> ## Documentation Index
> Fetch the complete documentation index at: https://stytch.com/docs/llms.txt
> Use this file to discover all available pages before exploring further.
# Event Log Streaming
> Stream your Stytch event logs to your preferred observability platform.
Event log streaming allows you to send the same activity logs already available in the Dashboard in real-time to your destination of choice. This enables easier debugging and monitoring of your authentication flows. This feature is particularly useful if:
* You are already using other tools or vendors for observability and monitoring purposes.
* You have different retention requirements than the default 30-day retention window Stytch provides.
* You want to set up monitoring and alerting side-by-side to your existing monitoring tooling.
We currently support:
* Streaming to a single destination per project
* Supported destinations are **Datadog** and **Grafana Loki**
If you'd like us to support more destination types, please [contact us](https://stytch.com/contact).
## Configuring streaming
You can configure event log streaming through the Dashboard or our management API. Furthermore, you can enable and disable streaming without having to delete your destination configuration. Note that re-enabling after disabling streaming will not backfill for the length of time it was disabled. Only new event logs will be streamed.
### Dashboard
Under the [Activity](https://stytch.com/dashboard/activity?tab=stream-settings) tab in the Stytch dashboard, navigate to Stream Settings:
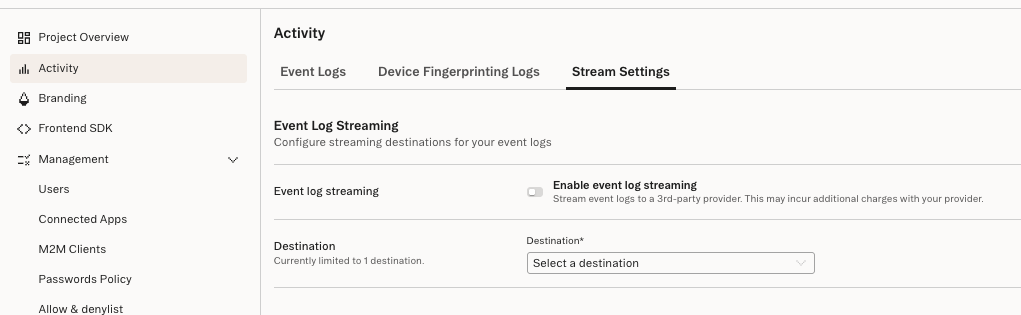 1. Select which supported destination type you want to stream logs to
2. Fill in the required information. See below for specifics for each destination type.
3. Save the changes
Once a configuration is stored, you **must** enable streaming and save that change. Logs should start flowing shortly afterwards.
Navigate to one of the guides below for an overview of what inputs you need to configure event log streaming.
### Management API (Programmatic Workspace Actions)
This is available via a direct HTTP API, our Go SDK, or our [Terraform provider](https://registry.terraform.io/providers/stytchauth/stytch/latest/docs/resources/event%5Flog%5Fstreaming). See the docs on [PWA](/api-reference/pwa/api/v3/overview) for more information.
## Destinations
### Datadog
For Datadog, you will need the following information:
1. **Datadog Site (Region):** This determines the Datadog endpoint Stytch will send logs to. You can find the available options in [this list](https://docs.datadoghq.com/getting%5Fstarted/site/), as well as information to see which one you are using.
2. **A Datadog API Key:** This key allows Stytch to authenticate with Datadog and send event data to your account. The key is typically a 32-character string using the characters 0-9 and a-f only.
#### Getting a Datadog API Key
You can create a Datadog API Key so that Stytch can send event logs to your Datadog instance. You can use an existing one if you'd like to, but we recommend creating a new one.
1. Sign in to your Datadog account
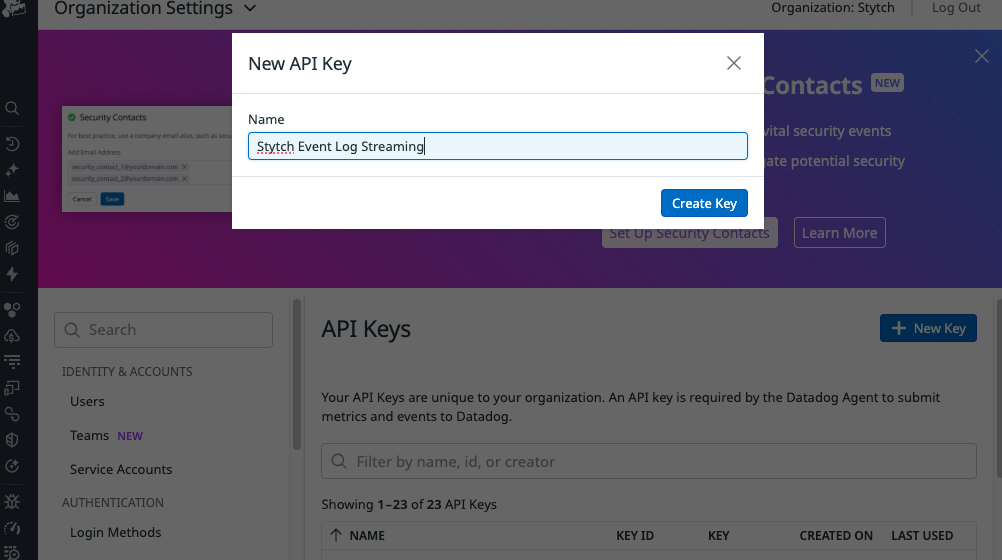
2. Navigate to the [API Keys](https://app.datadoghq.com/organization-settings/api-keys) page within your Organization Settings
3. Click on "New Key". Give it a name and create the key. Store the key in a safe place
*Note: You will also get a key ID. This is only an identifier for the key. This string is not equivalent to the API Key, and you do not need to provide this to us.*
1. Select which supported destination type you want to stream logs to
2. Fill in the required information. See below for specifics for each destination type.
3. Save the changes
Once a configuration is stored, you **must** enable streaming and save that change. Logs should start flowing shortly afterwards.
Navigate to one of the guides below for an overview of what inputs you need to configure event log streaming.
### Management API (Programmatic Workspace Actions)
This is available via a direct HTTP API, our Go SDK, or our [Terraform provider](https://registry.terraform.io/providers/stytchauth/stytch/latest/docs/resources/event%5Flog%5Fstreaming). See the docs on [PWA](/api-reference/pwa/api/v3/overview) for more information.
## Destinations
### Datadog
For Datadog, you will need the following information:
1. **Datadog Site (Region):** This determines the Datadog endpoint Stytch will send logs to. You can find the available options in [this list](https://docs.datadoghq.com/getting%5Fstarted/site/), as well as information to see which one you are using.
2. **A Datadog API Key:** This key allows Stytch to authenticate with Datadog and send event data to your account. The key is typically a 32-character string using the characters 0-9 and a-f only.
#### Getting a Datadog API Key
You can create a Datadog API Key so that Stytch can send event logs to your Datadog instance. You can use an existing one if you'd like to, but we recommend creating a new one.
1. Sign in to your Datadog account
2. Navigate to the [API Keys](https://app.datadoghq.com/organization-settings/api-keys) page within your Organization Settings
3. Click on "New Key". Give it a name and create the key. Store the key in a safe place
*Note: You will also get a key ID. This is only an identifier for the key. This string is not equivalent to the API Key, and you do not need to provide this to us.*
 If you are re-using a key or want to check that your API and site are correct, you can call Datadog's validate endpoint ([docs](https://docs.datadoghq.com/api/latest/authentication/#validate-api-key)). Just make sure to edit the site URL to the one that is relevant to you.
```bash theme={null}
# For the US site, the site URL is app.datadoghq.com
curl -X GET "https://app.datadoghq.com/api/v1/validate" \
-H "Accept: application/json" \
-H "DD-API-KEY: ${DD_API_KEY}"
```
#### Logs in Datadog
The logs will have the following Datadog-specific metadata:
* `source: stytch`
* `service: stytch.auth`
## Grafana Loki
Streaming to a Grafana Loki backend is supported. Keep in mind that this **must** be a Loki backend. We do not support forwarding to Prometheus metrics or any other Grafana-owned service.
1. **Loki HTTP API hostname:** This should be the hostname of a Loki log ingestion API endpoint that is accessible to the public internet. Specifically, we'll be hitting the Loki HTTP API documented on the [Grafana Labs Loki HTTP API](https://grafana.com/docs/loki/latest/reference/loki-http-api/).
* Your URL for ingestion should look something like: `https://{hostname}/loki/api/v1/push`
* **Note**: The https protocol and the endpoint path are static and added by Stytch. These cannot be modified.
2. **Authentication credentials:** We require Basic Auth for authentication. Therefore we need the following information:
* `username`
* `password`
**Note:** The user must have permissions to write logs to Loki.
#### Getting Grafana Loki Credentials (Grafana Cloud)
You'll need to set up a new access policy and token for your account.
**Getting a hostname and username**
1. Go to your Grafana Administration Cloud Portal
2. Click on your stack. This will show you the "Manage your stack" page
If you are re-using a key or want to check that your API and site are correct, you can call Datadog's validate endpoint ([docs](https://docs.datadoghq.com/api/latest/authentication/#validate-api-key)). Just make sure to edit the site URL to the one that is relevant to you.
```bash theme={null}
# For the US site, the site URL is app.datadoghq.com
curl -X GET "https://app.datadoghq.com/api/v1/validate" \
-H "Accept: application/json" \
-H "DD-API-KEY: ${DD_API_KEY}"
```
#### Logs in Datadog
The logs will have the following Datadog-specific metadata:
* `source: stytch`
* `service: stytch.auth`
## Grafana Loki
Streaming to a Grafana Loki backend is supported. Keep in mind that this **must** be a Loki backend. We do not support forwarding to Prometheus metrics or any other Grafana-owned service.
1. **Loki HTTP API hostname:** This should be the hostname of a Loki log ingestion API endpoint that is accessible to the public internet. Specifically, we'll be hitting the Loki HTTP API documented on the [Grafana Labs Loki HTTP API](https://grafana.com/docs/loki/latest/reference/loki-http-api/).
* Your URL for ingestion should look something like: `https://{hostname}/loki/api/v1/push`
* **Note**: The https protocol and the endpoint path are static and added by Stytch. These cannot be modified.
2. **Authentication credentials:** We require Basic Auth for authentication. Therefore we need the following information:
* `username`
* `password`
**Note:** The user must have permissions to write logs to Loki.
#### Getting Grafana Loki Credentials (Grafana Cloud)
You'll need to set up a new access policy and token for your account.
**Getting a hostname and username**
1. Go to your Grafana Administration Cloud Portal
2. Click on your stack. This will show you the "Manage your stack" page
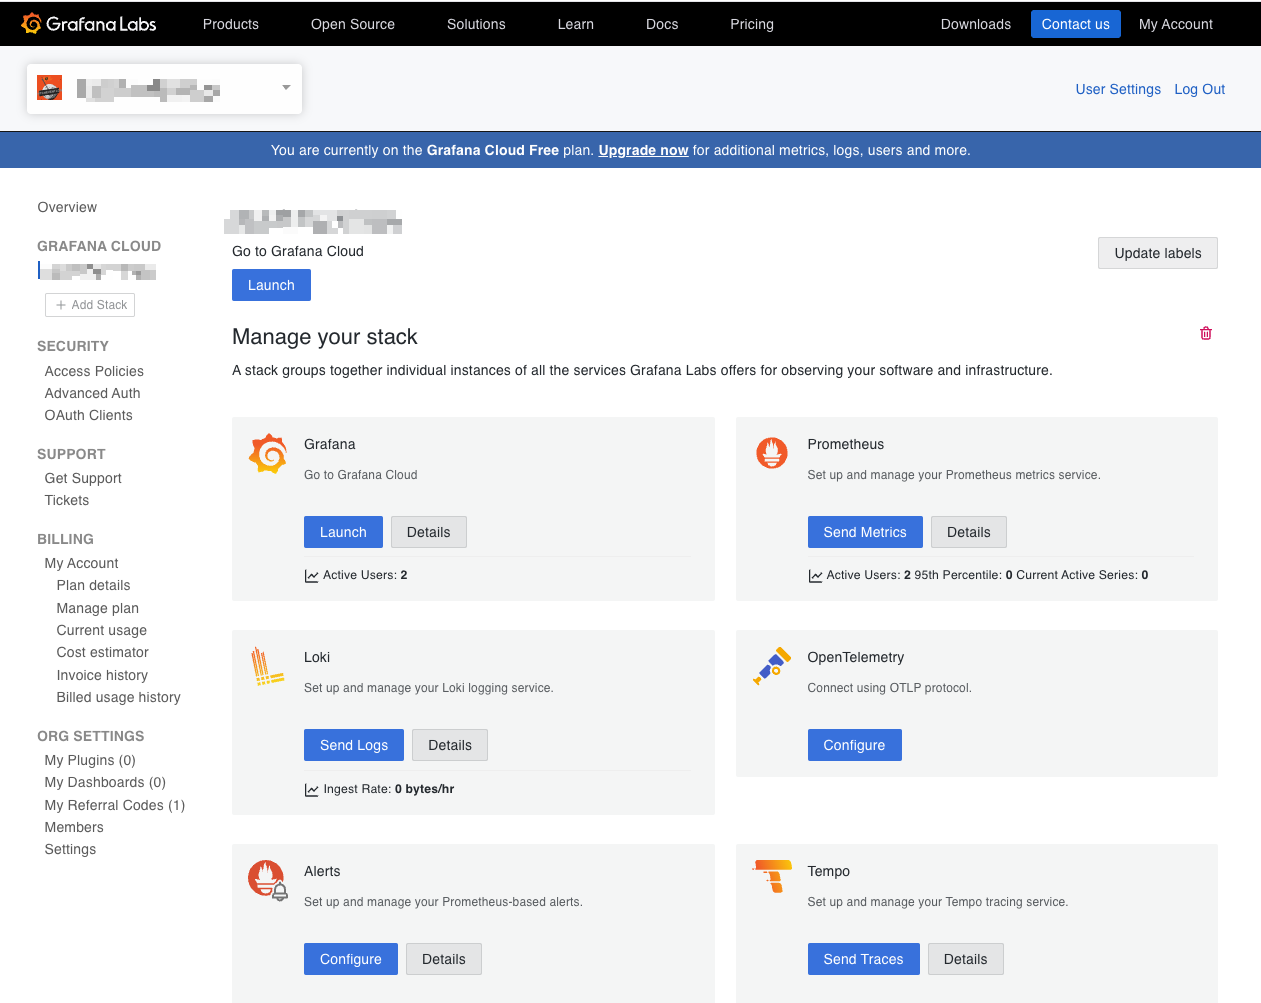 3. Click on Loki -> Send Logs
4. You will see a box with your auth settings. This will have Name, URL, Basic Auth (checked), User, and Password
3. Click on Loki -> Send Logs
4. You will see a box with your auth settings. This will have Name, URL, Basic Auth (checked), User, and Password
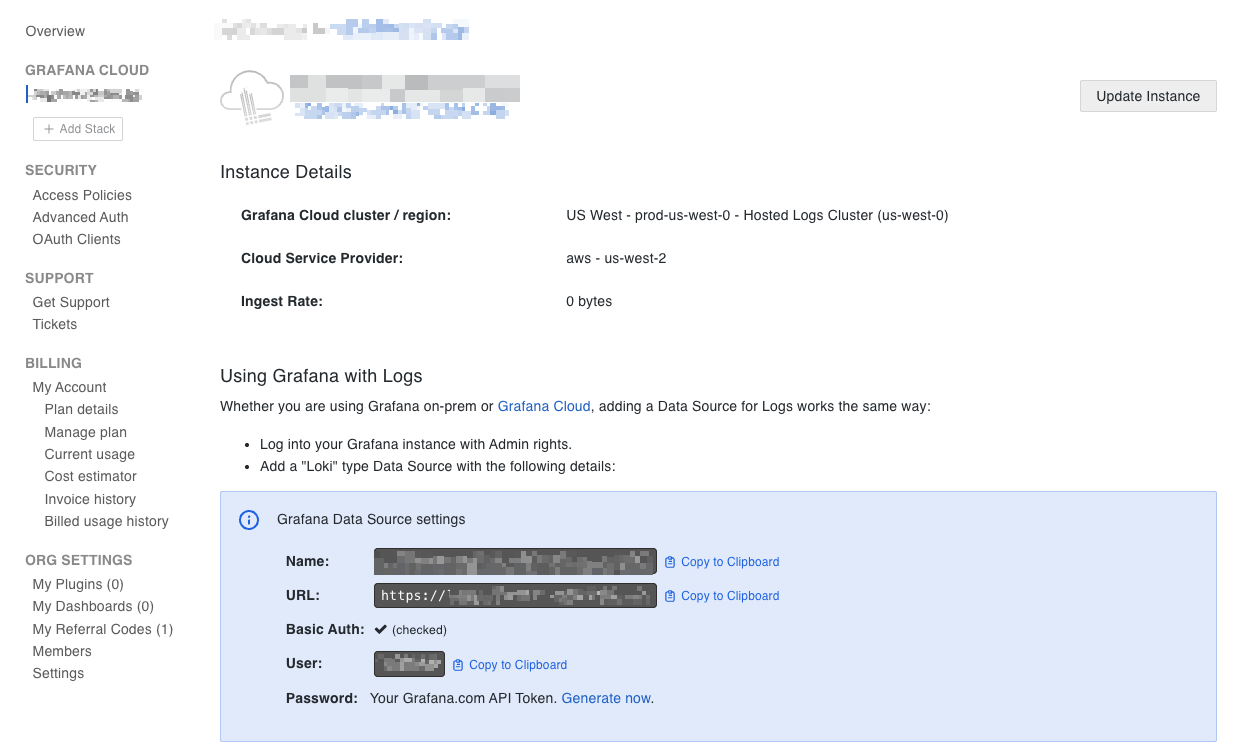 5. Your hostname is the URL **without** the protocol. For example, logs-prod-021.grafana.net
6. The username is the string in the User field
**Getting a password (token)**
1. In the same Grafana Administration Cloud Portal, click on "Access Policies" in the Security section
5. Your hostname is the URL **without** the protocol. For example, logs-prod-021.grafana.net
6. The username is the string in the User field
**Getting a password (token)**
1. In the same Grafana Administration Cloud Portal, click on "Access Policies" in the Security section
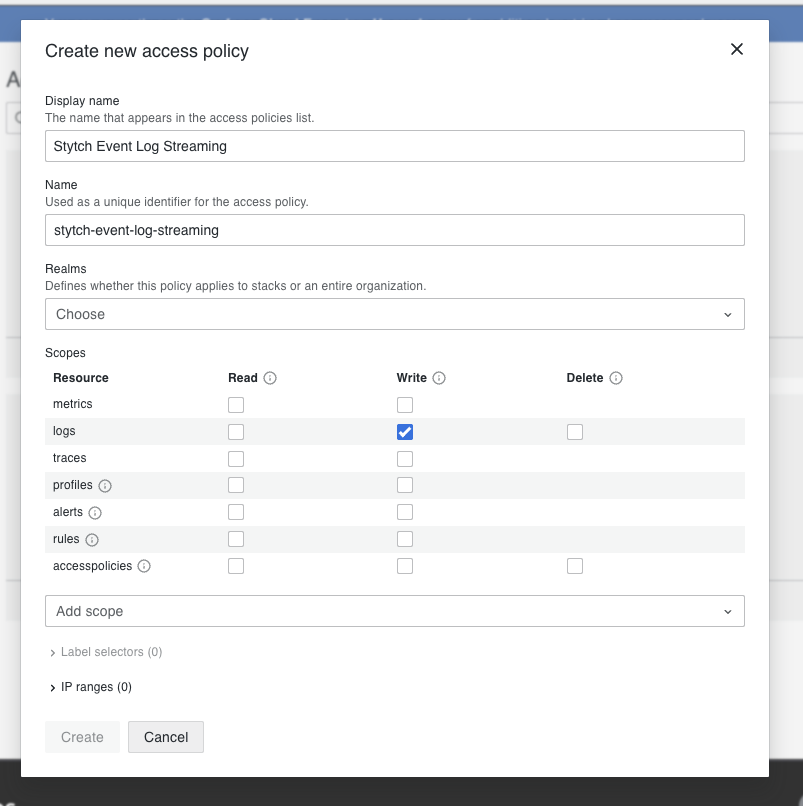
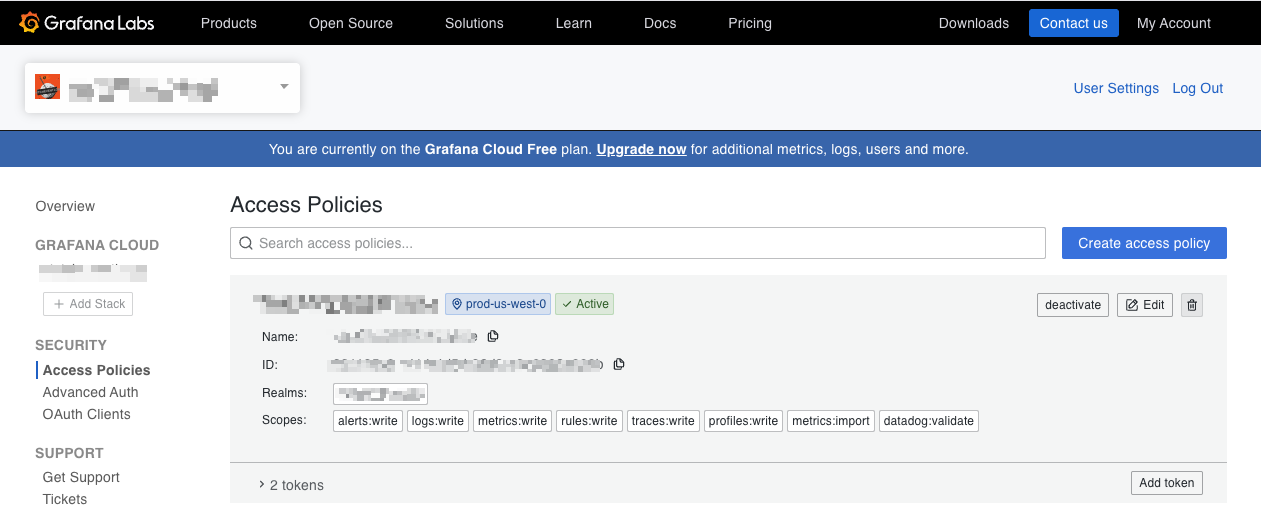 2. Create a new access policy or reuse an existing one. Set up the realm and scope that you need for your setup. To forward logs, you need logs:write
 3. Once created, click on "Add token" and give it a name
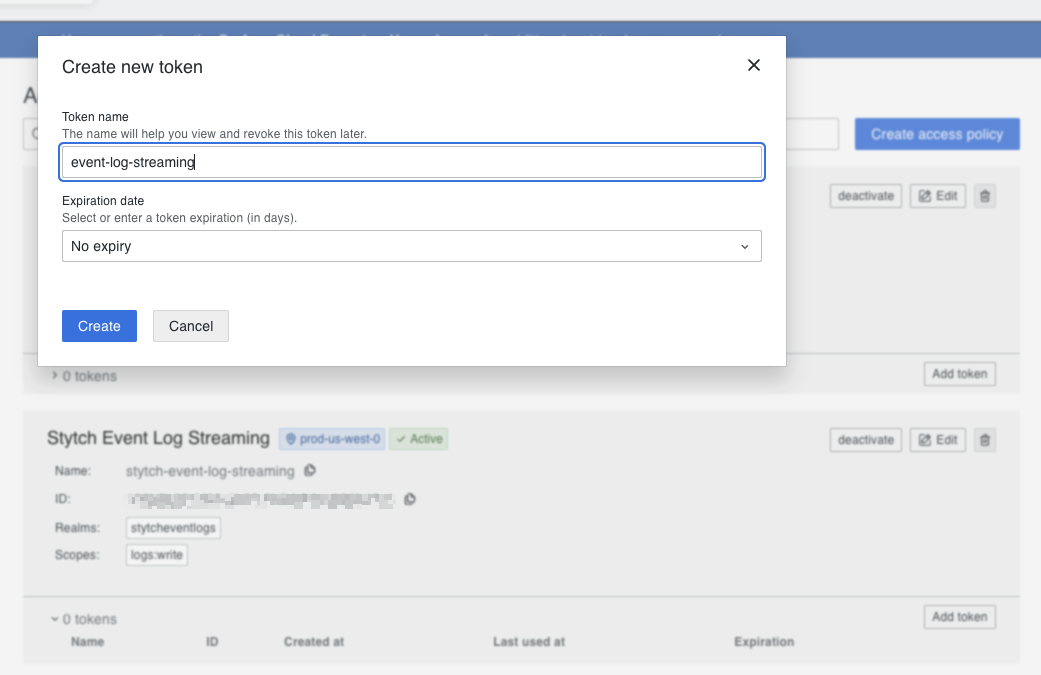 4. You will get a token. This is the password used in authentication. Copy this and store it in a safe place.
#### Logs in Grafana Loki
Logs will be sent in gzipped compressed JSON format, which is supported by Grafana Loki's [HTTP push endpoint](https://grafana.com/docs/loki/latest/reference/loki-http-api/#ingest-logs).
The logs will have 2 additional labels. These can be used to filter for only these logs when querying Loki.
* source: stytch
* service\_name: stytch.auth
### Loki to S3 bridge
Even though Stytch does not yet support direct S3 forwarding, you can achieve this by creating a service compatible with the Loki ingestion endpoint and setting up relevant infrastructure on your end. The open source repository [stytch-loki-ingestion-example](https://github.com/Essential-Personnel/stytch-loki-ingestion-example) has an example of how you can do this with AWS infrastructure.
***Note: This repository is not owned, maintained, or audited by Stytch. This is entirely owned by a third-party, who agreed with Stytch sharing it for others to use.***
4. You will get a token. This is the password used in authentication. Copy this and store it in a safe place.
#### Logs in Grafana Loki
Logs will be sent in gzipped compressed JSON format, which is supported by Grafana Loki's [HTTP push endpoint](https://grafana.com/docs/loki/latest/reference/loki-http-api/#ingest-logs).
The logs will have 2 additional labels. These can be used to filter for only these logs when querying Loki.
* source: stytch
* service\_name: stytch.auth
### Loki to S3 bridge
Even though Stytch does not yet support direct S3 forwarding, you can achieve this by creating a service compatible with the Loki ingestion endpoint and setting up relevant infrastructure on your end. The open source repository [stytch-loki-ingestion-example](https://github.com/Essential-Personnel/stytch-loki-ingestion-example) has an example of how you can do this with AWS infrastructure.
***Note: This repository is not owned, maintained, or audited by Stytch. This is entirely owned by a third-party, who agreed with Stytch sharing it for others to use.***