Back to blog
Understanding SLAs, SLOs, SLIs and Error Budgets
Engineering
May 21, 2025
Author: Stytch Team
Author: Danny Thompson
At Stytch, we’re deeply committed to ensuring the reliability of our services—as critical infrastructure for our customers, our downtime is their downtime. Building a strong culture of operational excellence has been a cornerstone of our engineering team from day one. This post outlines how we instrumented SLA and SLO tracking and spun up a lightweight public tool, error-budget.dev, to help you better understand error budgets.
Before diving into our implementation, it's helpful to define what SLAs, SLOs, SLIs, and Error Budgets actually are, and how they relate to each other:
- SLA (Service Level Agreement): A contractually binding agreement with a customer that specifies the level of service they can expect. At Stytch, our highest available SLA promises 99.999% uptime for enterprise customers.
- SLO (Service Level Objective): An internal performance goal that engineering teams use to measure service health over a period of time. It's typically more stringent than the SLA and is used to inform whether we're on track to meet our commitments.
- SLI (Service Level Indicator): A quantitative measure of performance (like success rate or latency) that serves as the "ground truth" for SLOs and SLAs.
- Error Budget: A representation of the allowable amount of downtime a service can tolerate while still meeting its SLO. For example, for a 99.999% SLA, this is 0.001% (100% - 99.999%), which means we can tolerate a 0.001% error rate over a month. However, a 0.001% error rate over a month isn’t generally helpful since errors aren’t typically evenly distributed and tend to occur at higher rates for a shorter period of time (i.e. 10% failure over 1 minute). An error budget helps visualize the remaining allowed failures before validating the SLO.
The SLI is defined by a formula that classifies an event as uptime (True), downtime (False), or not relevant (null). These events can come from any different data sources (e.g. any metric in Datadog, any span in Honeycomb, or a log in Elastic). Not all events are relevant, some could be an internal metric that measures a specific product detail or usage or a span that represents an internal implementation details. An SLO is created by measuring an SLI over a time period to define a service’s uptime. It’s calculated by dividing successful events by the sum of the failure and successful events during a time frame, typically spanning some number of days (e.g. 30 or 90 days). An SLA can be thought of as a commitment of our SLO to a customer.
A common pitfall in this process is either defining an SLA that's too aggressive without real data, or anchoring SLOs strictly on existing performance without pushing for improvement.
Why we needed a better way to track uptime
Our original method of tracking uptime relied on time intensive manual calculations, while we had dashboards tracking error rates, it was hard to answer the question “what was our uptime for the past month” without the manual process. This is also separate from our status page which calculates a flat percentage for each type of incident, such as partial outage or degraded performance, which led to an imprecise estimate that typically overstates downtime. While this approach worked for major incidents, it fell short in providing continuous visibility into performance and quantifying smaller blips that could collectively push us over our error budgets.
This gap meant we weren’t always equipped to quickly and efficiently:
- Accurately determine SLIs for services.
- Understand historical trends for service availability
- Foster internal accountability across engineering teams and shared understanding of SLOs.
We’ve historically focused internally on our 99.999% enterprise SLA which is largely meant to cover major outages and provide relief to our customers. . However, this metric doesn’t fully capture the precise health of our services which should include partial outages affecting specific endpoints or functionality while the rest of the API remains operational. To address this shortcoming, we introduced more comprehensive SLIs, SLOs, and error budgets.
Instrumenting SLOs
First, we needed to define an SLI for our Auth API. As an API based company, we should base our SLI on our HTTP request statuses. However, each endpoint has its own requirements (e.g. our session authentication endpoint needs to be really fast, but sending an SMS OTP endpoint requires calls from an external SMS provider and user interaction), and we cannot have a single rule for all endpoints. Here's a look at our implementation:
Endpoint Categorization
We started to categorize the different API endpoints with the following three fields:
- Plane:
DATA– This is where user authentication occurs, integrated into a customer’s application. Whenever an end-user takes an action, they are operating on the data plane. While the developer can take some actions here like creating an organization from the Stytch dashboard, most interactions in the data plane are started by the user.CONTROL– This is where the developer configures their projects within Stytch, with all relevant settings located in the Dashboard service. This has lower uptime requirements since its responsibilities are administrative and configuration focused.
- Expected Availability:
CRITICALorLOW- Within the data plane, we have a concept of blocking (
CRITICAL) and non-blocking (LOW) endpoints. Blocking endpoints will prevent a customer from completing an auth event (e.g. oauth authenticate), while non-blocking events don’t prevent our customer’s users from using the customer’s app (e.g. WhoAmI).
- Within the data plane, we have a concept of blocking (
- Expected Latency:
FAST,MEDIUM,SLOW,EXTERNAL_CALL- A fast API is a core piece of the Stytch experience since a user facing a slow API call is more likely to navigate away. Since different endpoints will have different latency expectations, we group the endpoints into different buckets based. These buckets have different thresholds based on their expected latency, and we expect our endpoints to be within those thresholds.
Defining successful and failure events
A “successful” SLI event means:
- A non-5xx response, and
- Latency meets the expectation set by the endpoint’s tag. and
- The Plane is
DATA. While the control plane is valuable, our contractual SLA is based on our commitment to the data plane, as this uptime directly impacts our developer’s application uptime. Therefore, we should focus our uptime definition based on theDATAplane andCRITICALavailability endpoints.
A “failure” SLI event means:
- The Plane is DATA since we only want to count
DATAendpoints and- A 5xx response, or
- Latency violates the expectation set by the endpoint’s tag
This enables us to calculate an accurate SLO ratio: Successful Events / Total Events (for eligible endpoints).
Alerting: catching issues before they escalate
We set up burn rate alerts to flag when the SLO is at risk. A burn rate of 4 (i.e., exhausting the budget in 7.5 days) triggers an alert; 2 triggers a warning. This balance gives us time to investigate without flooding channels with noise.
In summary, SLO burn alerts provide a critical framework for managing service reliability in a data-driven way. By defining an acceptable threshold for failures, error budgets allow teams to quantify how much downtime or degraded performance is permissible while still meeting SLO commitments and define an alerting threshold that allows you to quickly identify and fix more systemic issues.
Helping everyone understand Error Budgets: error-budget.dev
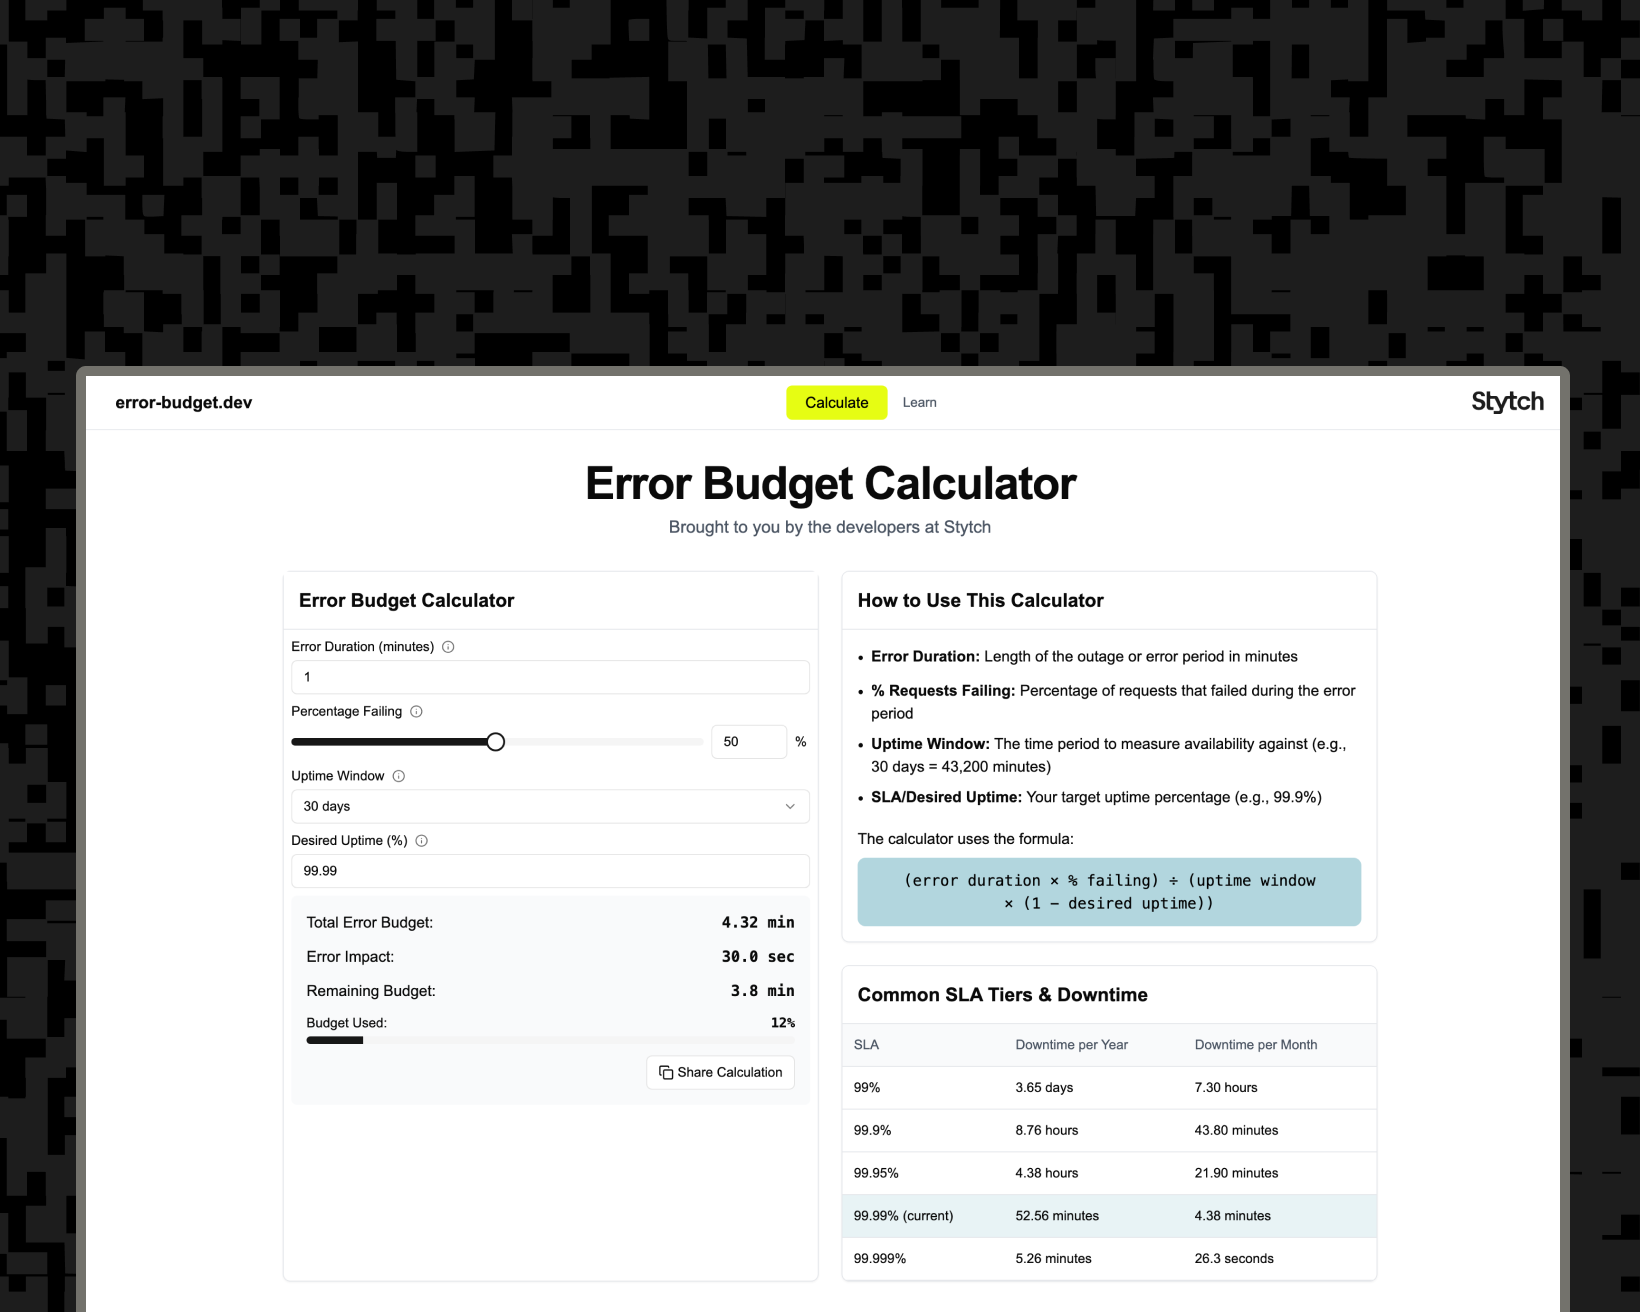
This month, Stytch had a company wide hackathon where we worked on experimenting and shipping small projects. One project we wanted to take on was how we can visualize what various SLA commitments actually mean in practice. This is how we built error-budget.dev, a micro-site where you can calculate your error budget.
Evaluating the reliability of your infrastructure providers can be challenging to wrap your head around without tangible metrics, enter error-budget.dev, making it easy to understand how SLAs inform error budgets. As you can probably tell from the above discussion, it can be difficult to properly visualize an error budget without prior context. To calculate your error budget, you need to run the following equation:
(error duration × % failing) ÷ (uptime window × (1 - desired uptime))
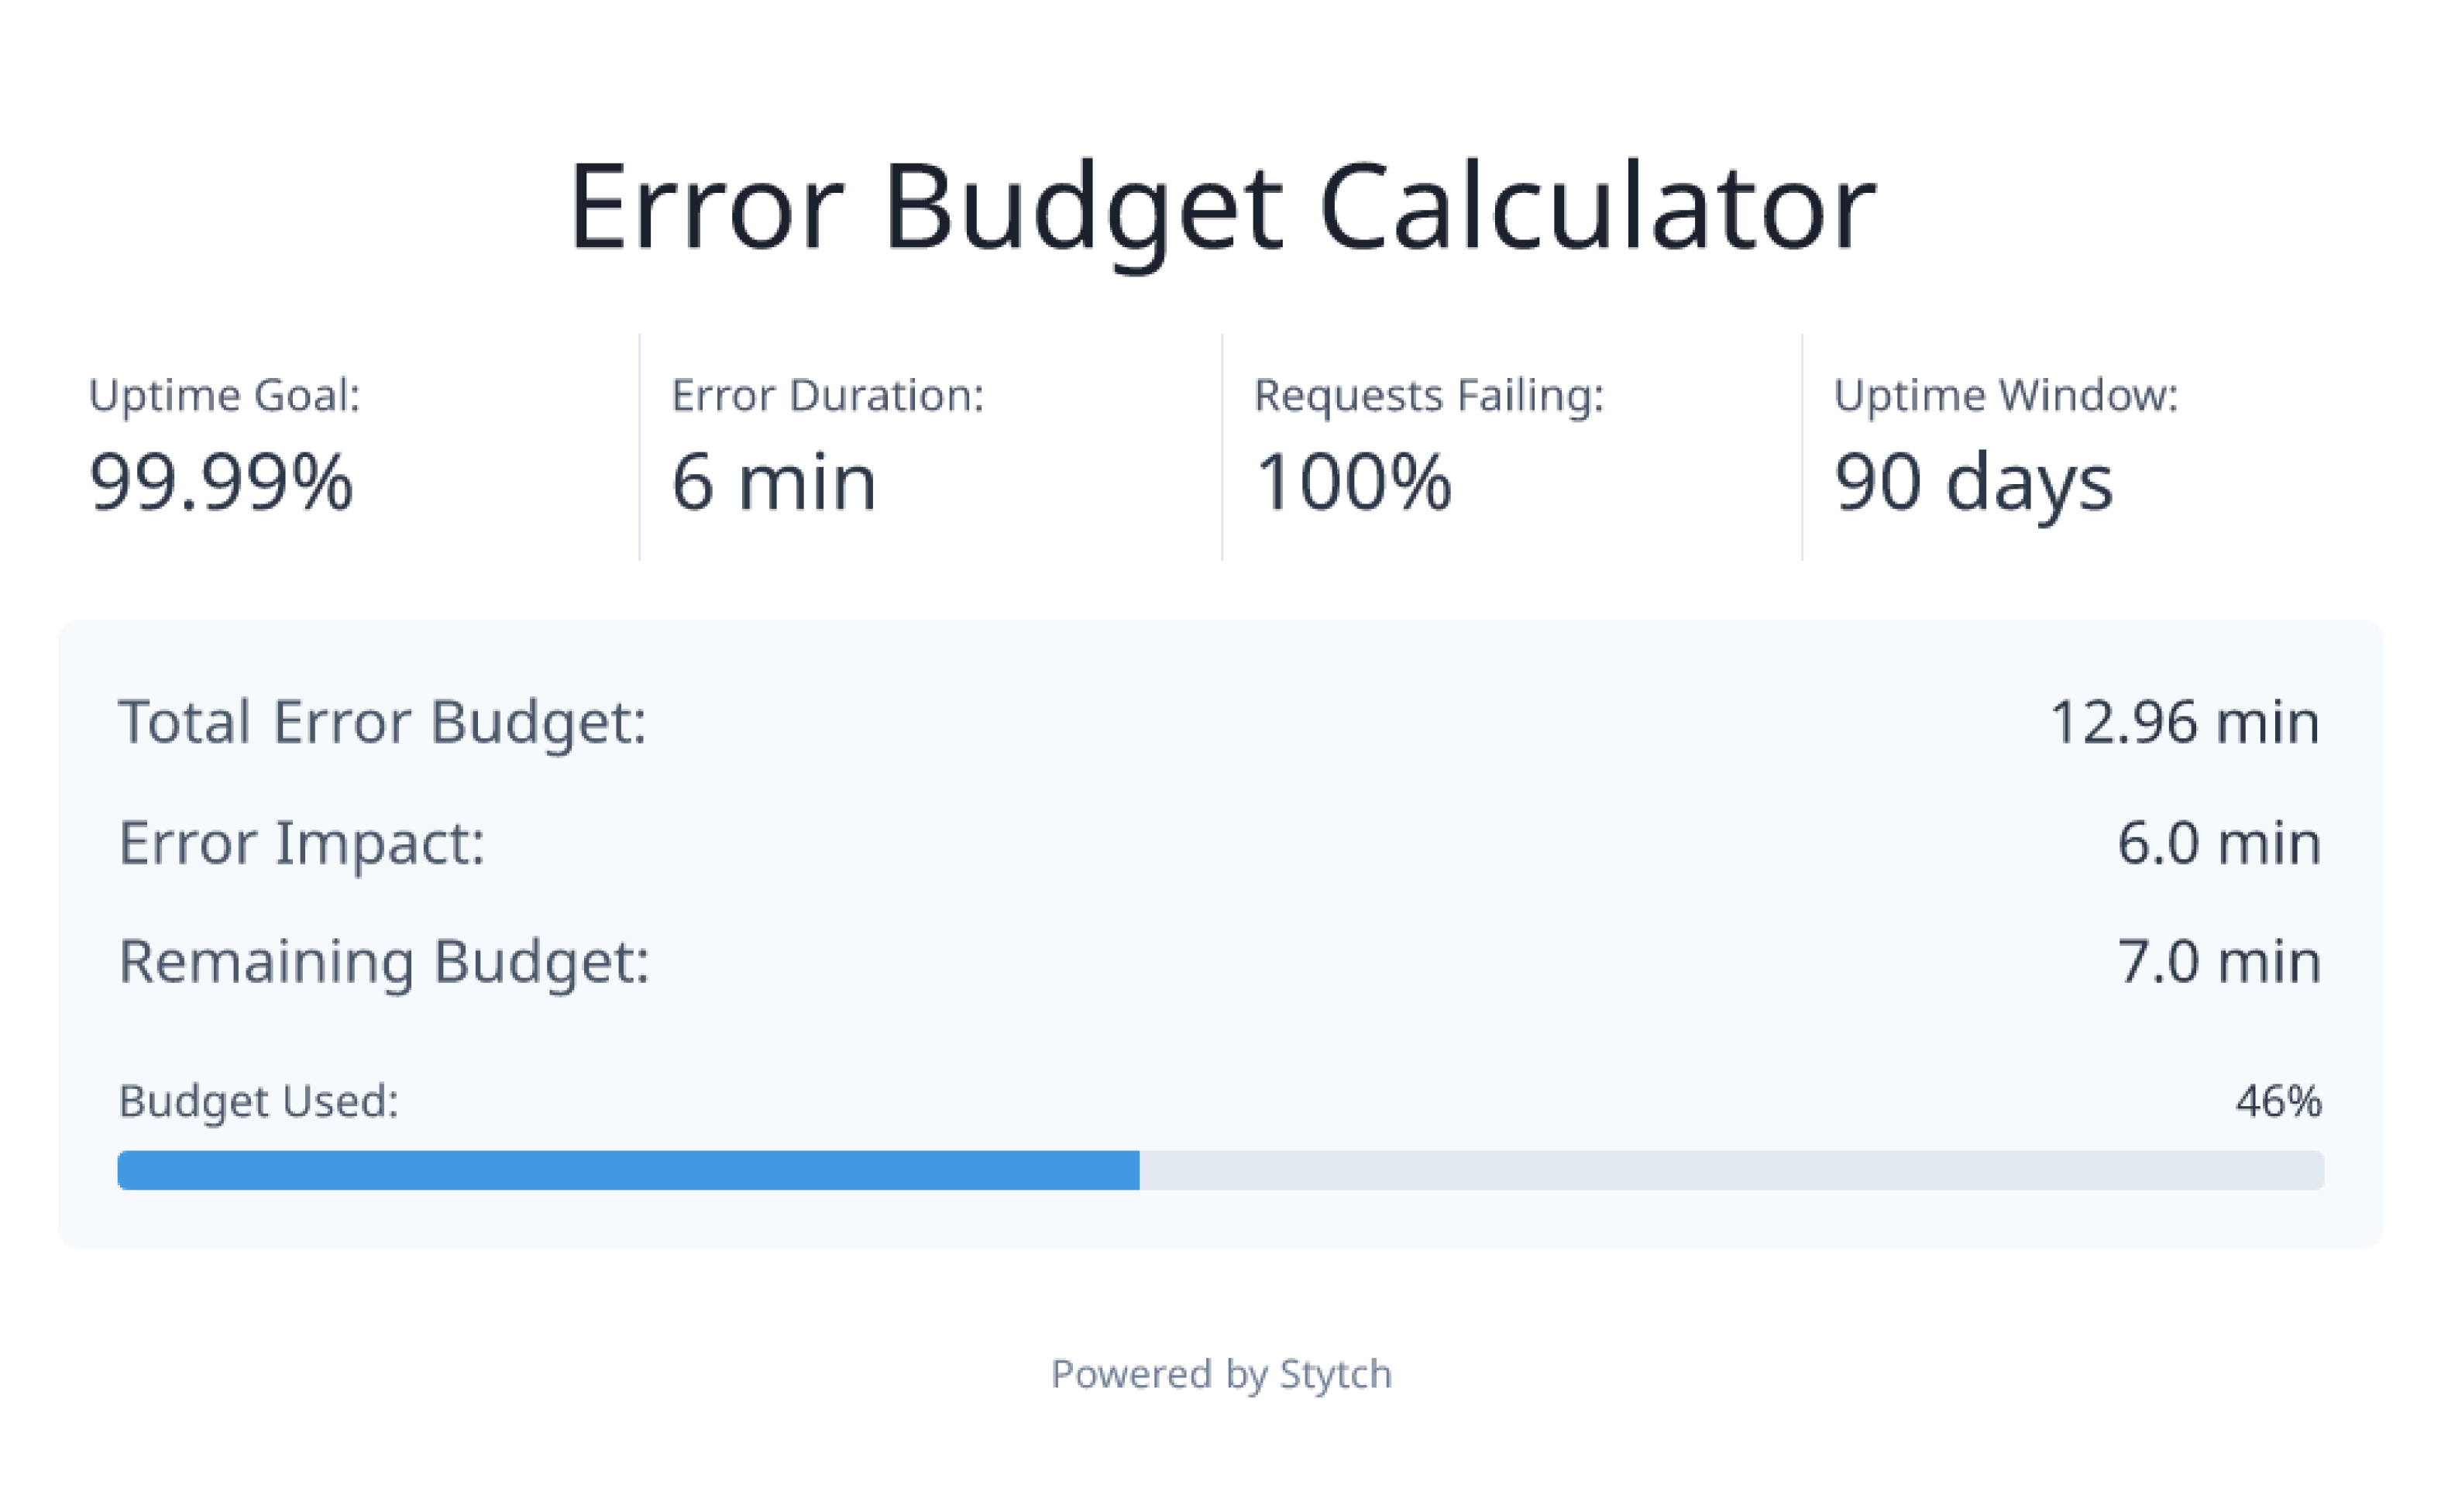
Here are two examples to help visualize how error budgets are calculated using real examples:
In one scenario, let's say we have an uptime goal of 99.99% over 90 days. If the error rate is at 100% for 6 minutes, 46% of our error budget will have been used for that quarter.
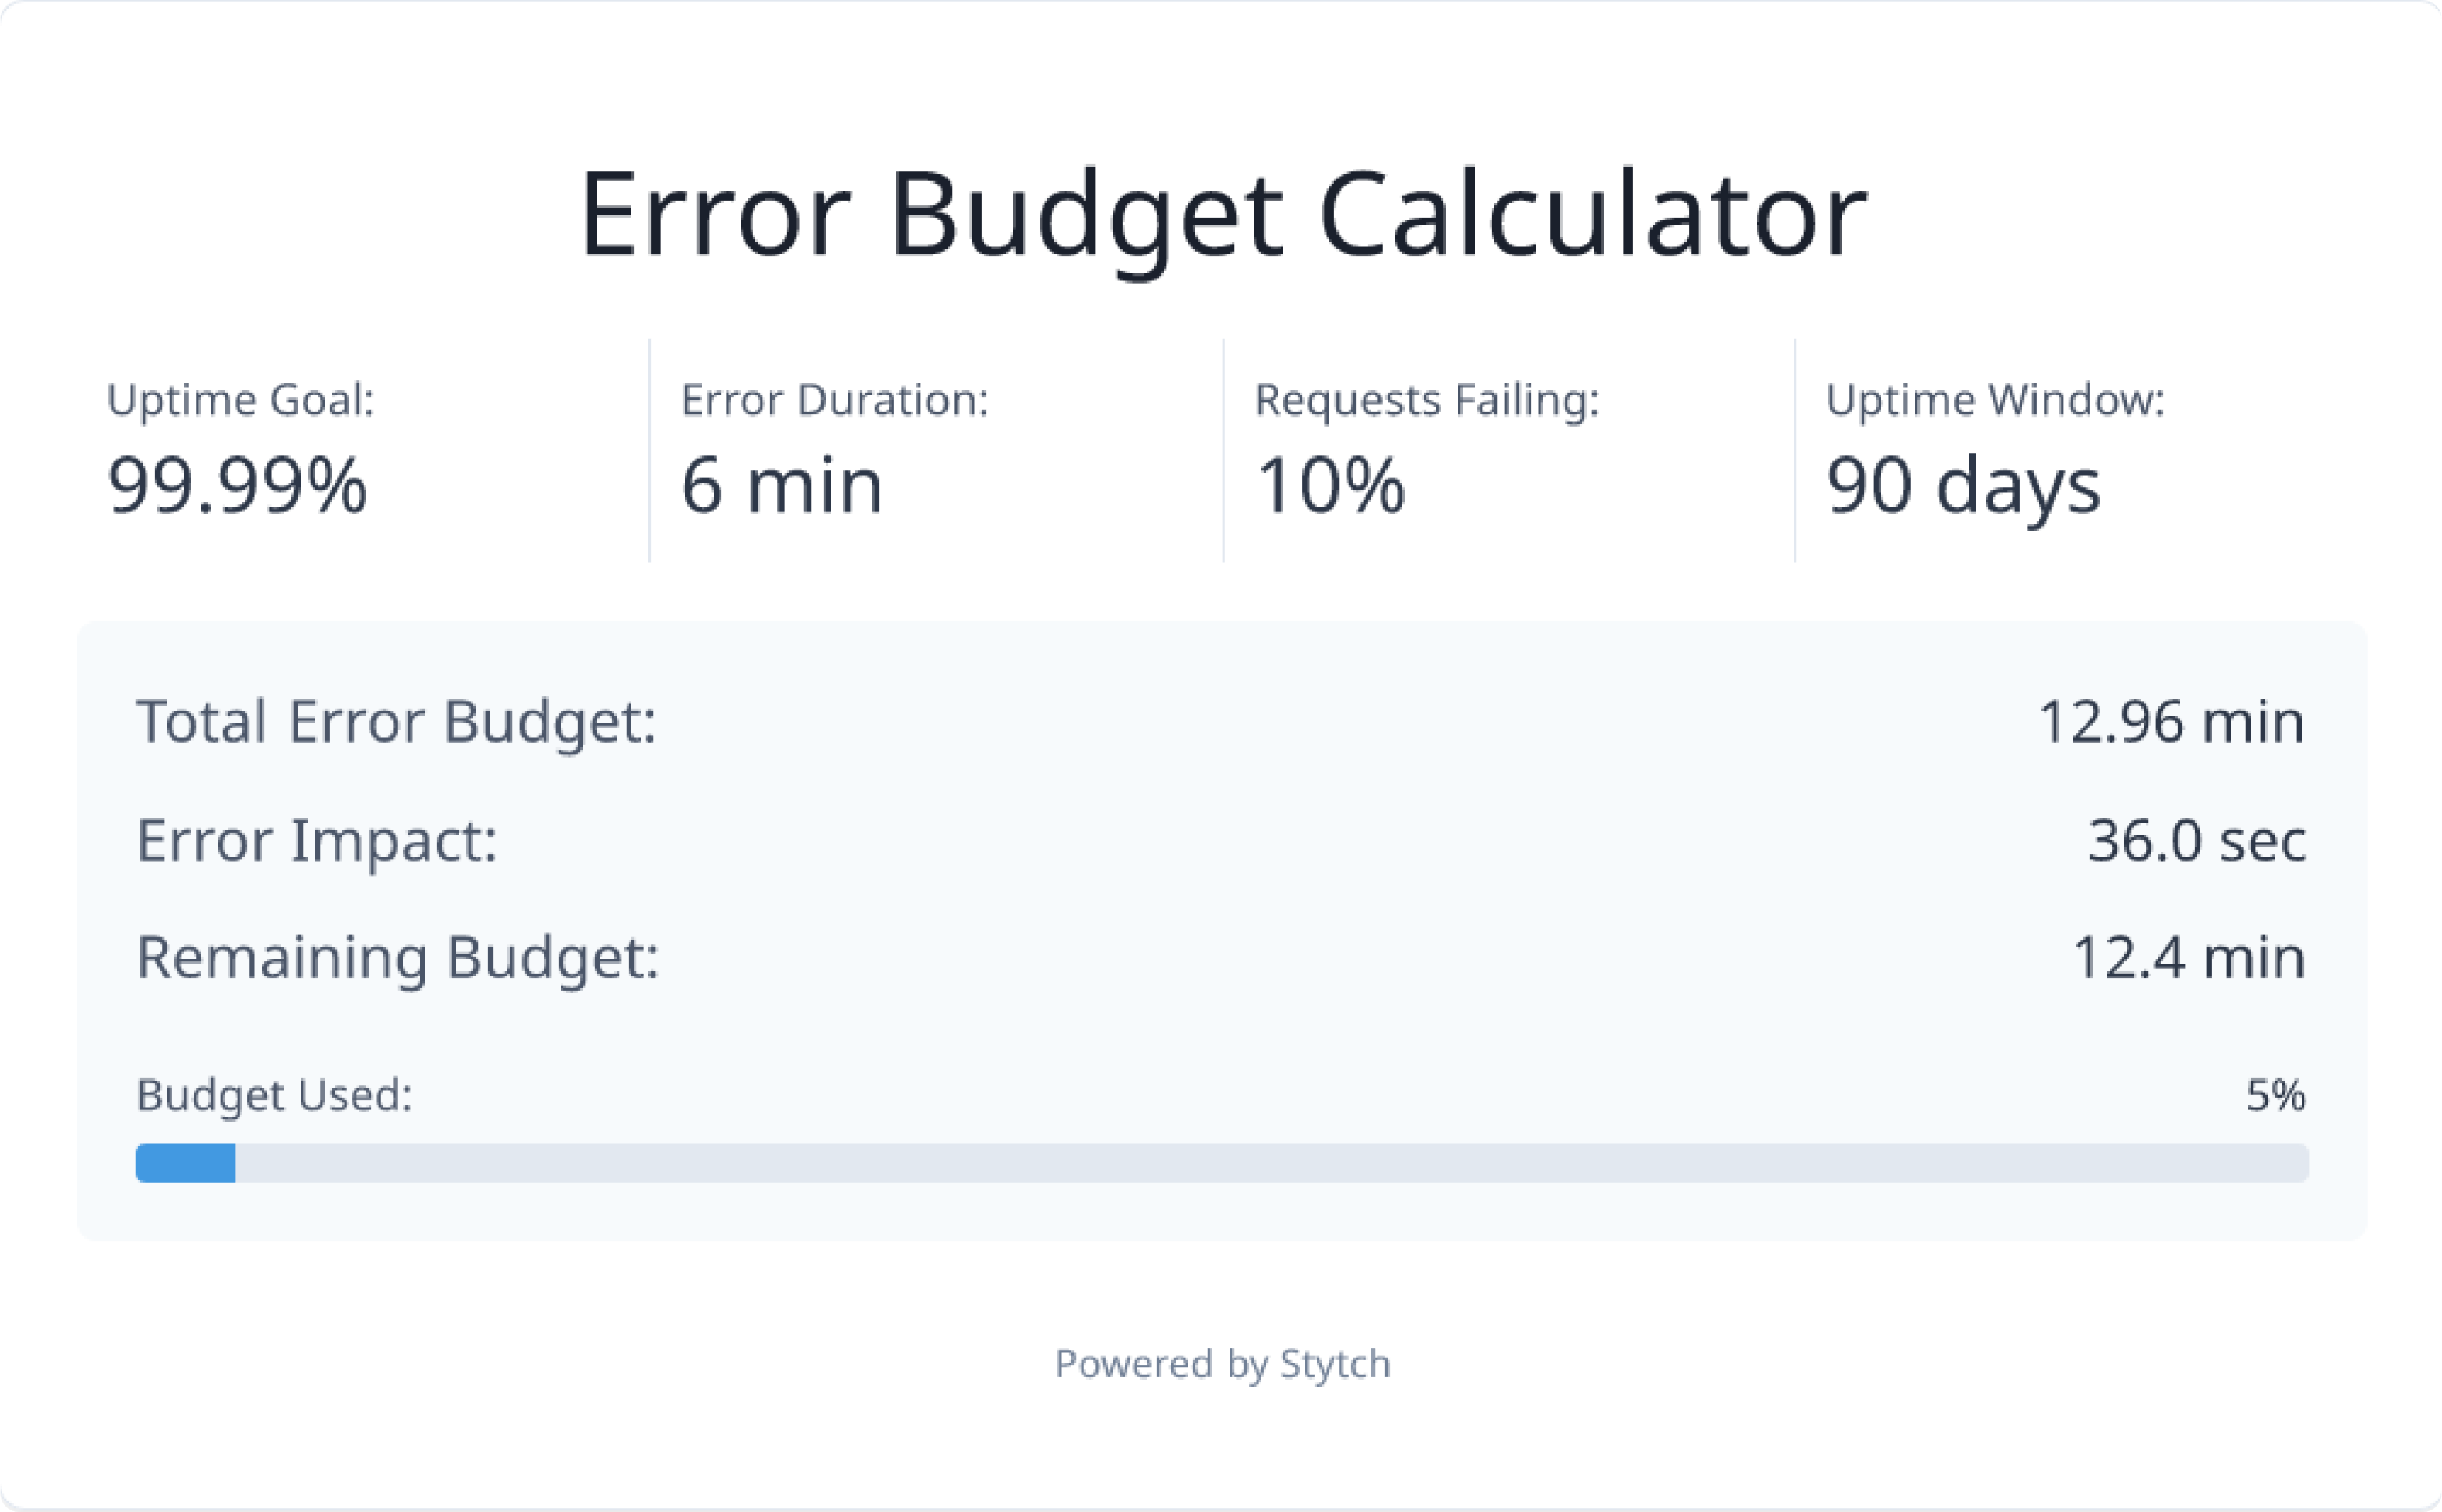
In another scenario where there is a 10% error rate (shown below), 5% of the error budget for the quarter will have been used up. While the time duration and uptime goal remain the same between these scenarios, we can see there’s a significant difference in the error budget being used.
Experimenting with AI coding tools
To build error-budget.dev, we saw this as an opportunity to experiment with AI coding tools for quick development during a three day hackathon. We used Vercel’s v0 to do a first pass on the design and UI, and then moved over to Cursor to refine and polish it.
Here’s a brief behind-the-scenes:
To begin, we decided to use reference visuals from Stytch for inspiration.
- Starting with the basic prompt to create an error budget calculator with the formula above, the following page was generated:
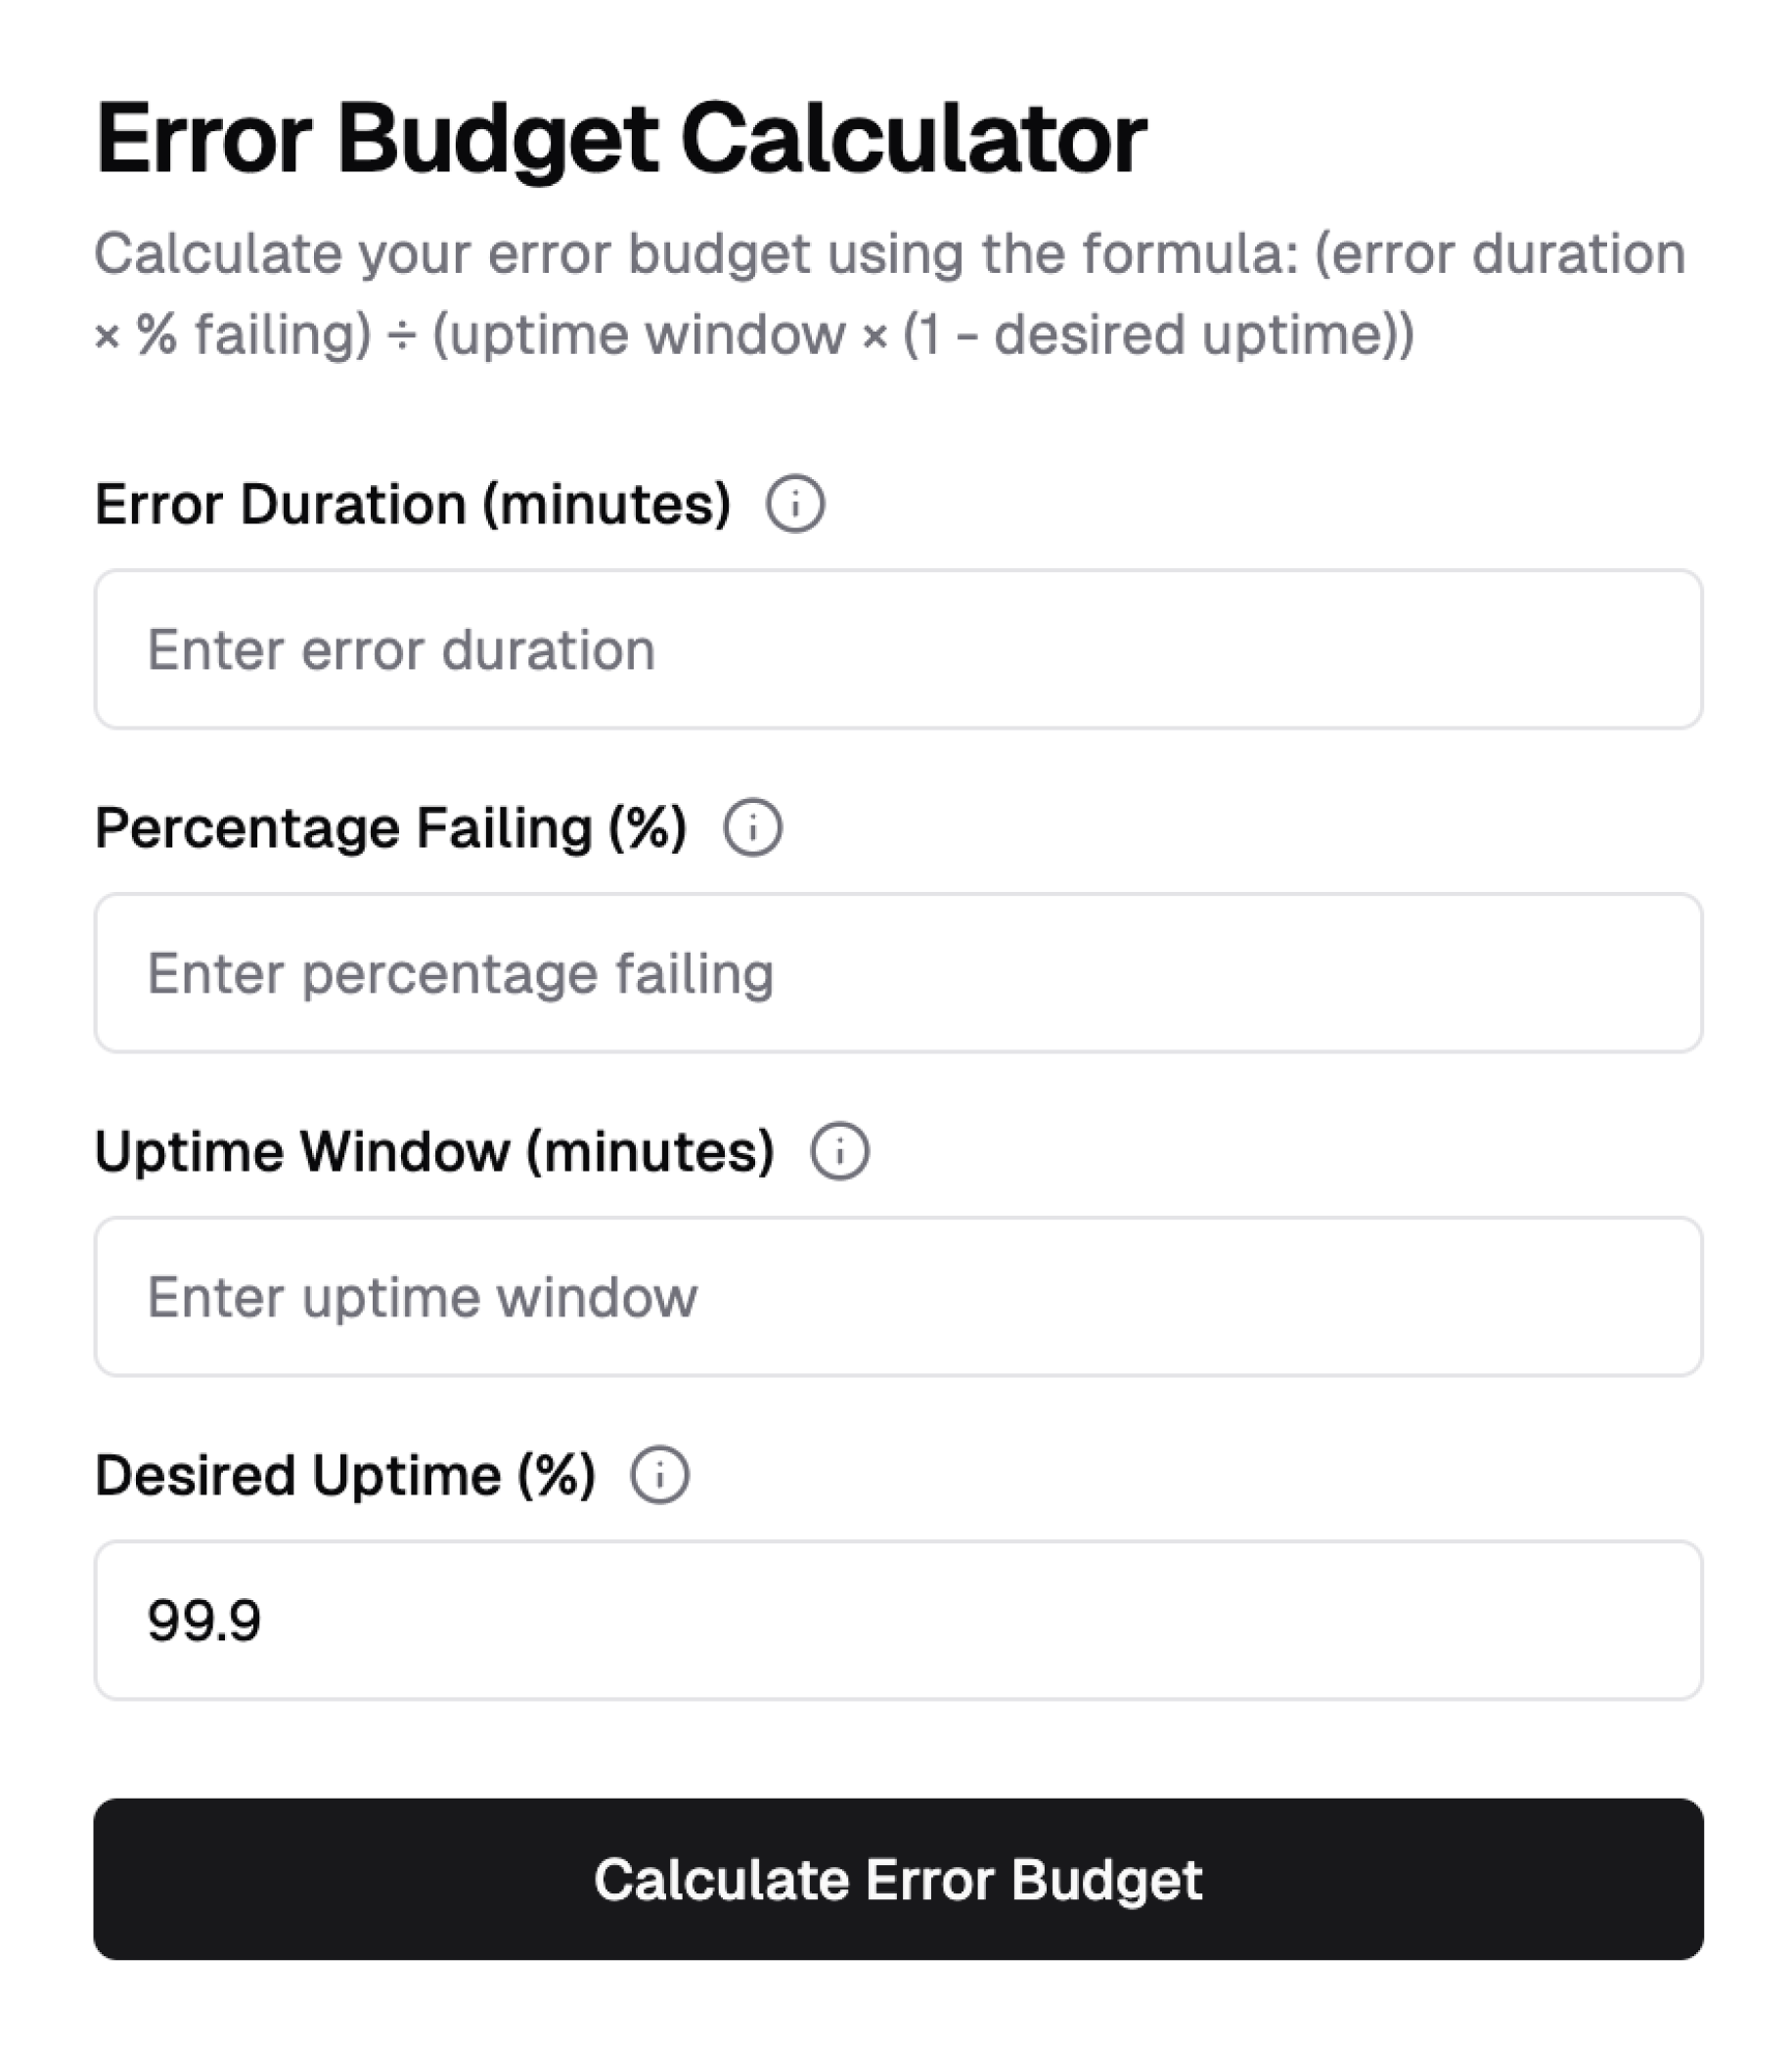
- This was a great starting point which was then iterated upon to incorporate more Stytch branding via screenshots of stytch.com, and quality of life improvements like adding a slider for the percentage selector, and autocalculating the error budget as inputs are changed.
- Now that we had a solid starting point to work with, we brought it into our local dev environment for further customization and refinement.
We then pulled down the generated code and refined it using Cursor, our IDE of choice for AI-assisted coding. This made it easy to build more feature like:
- A click to share button which copies the URL with the current error budget configuration to share with teammates
- Additional tabs that help teach users what SLAs, SLOs, and error budgets are.
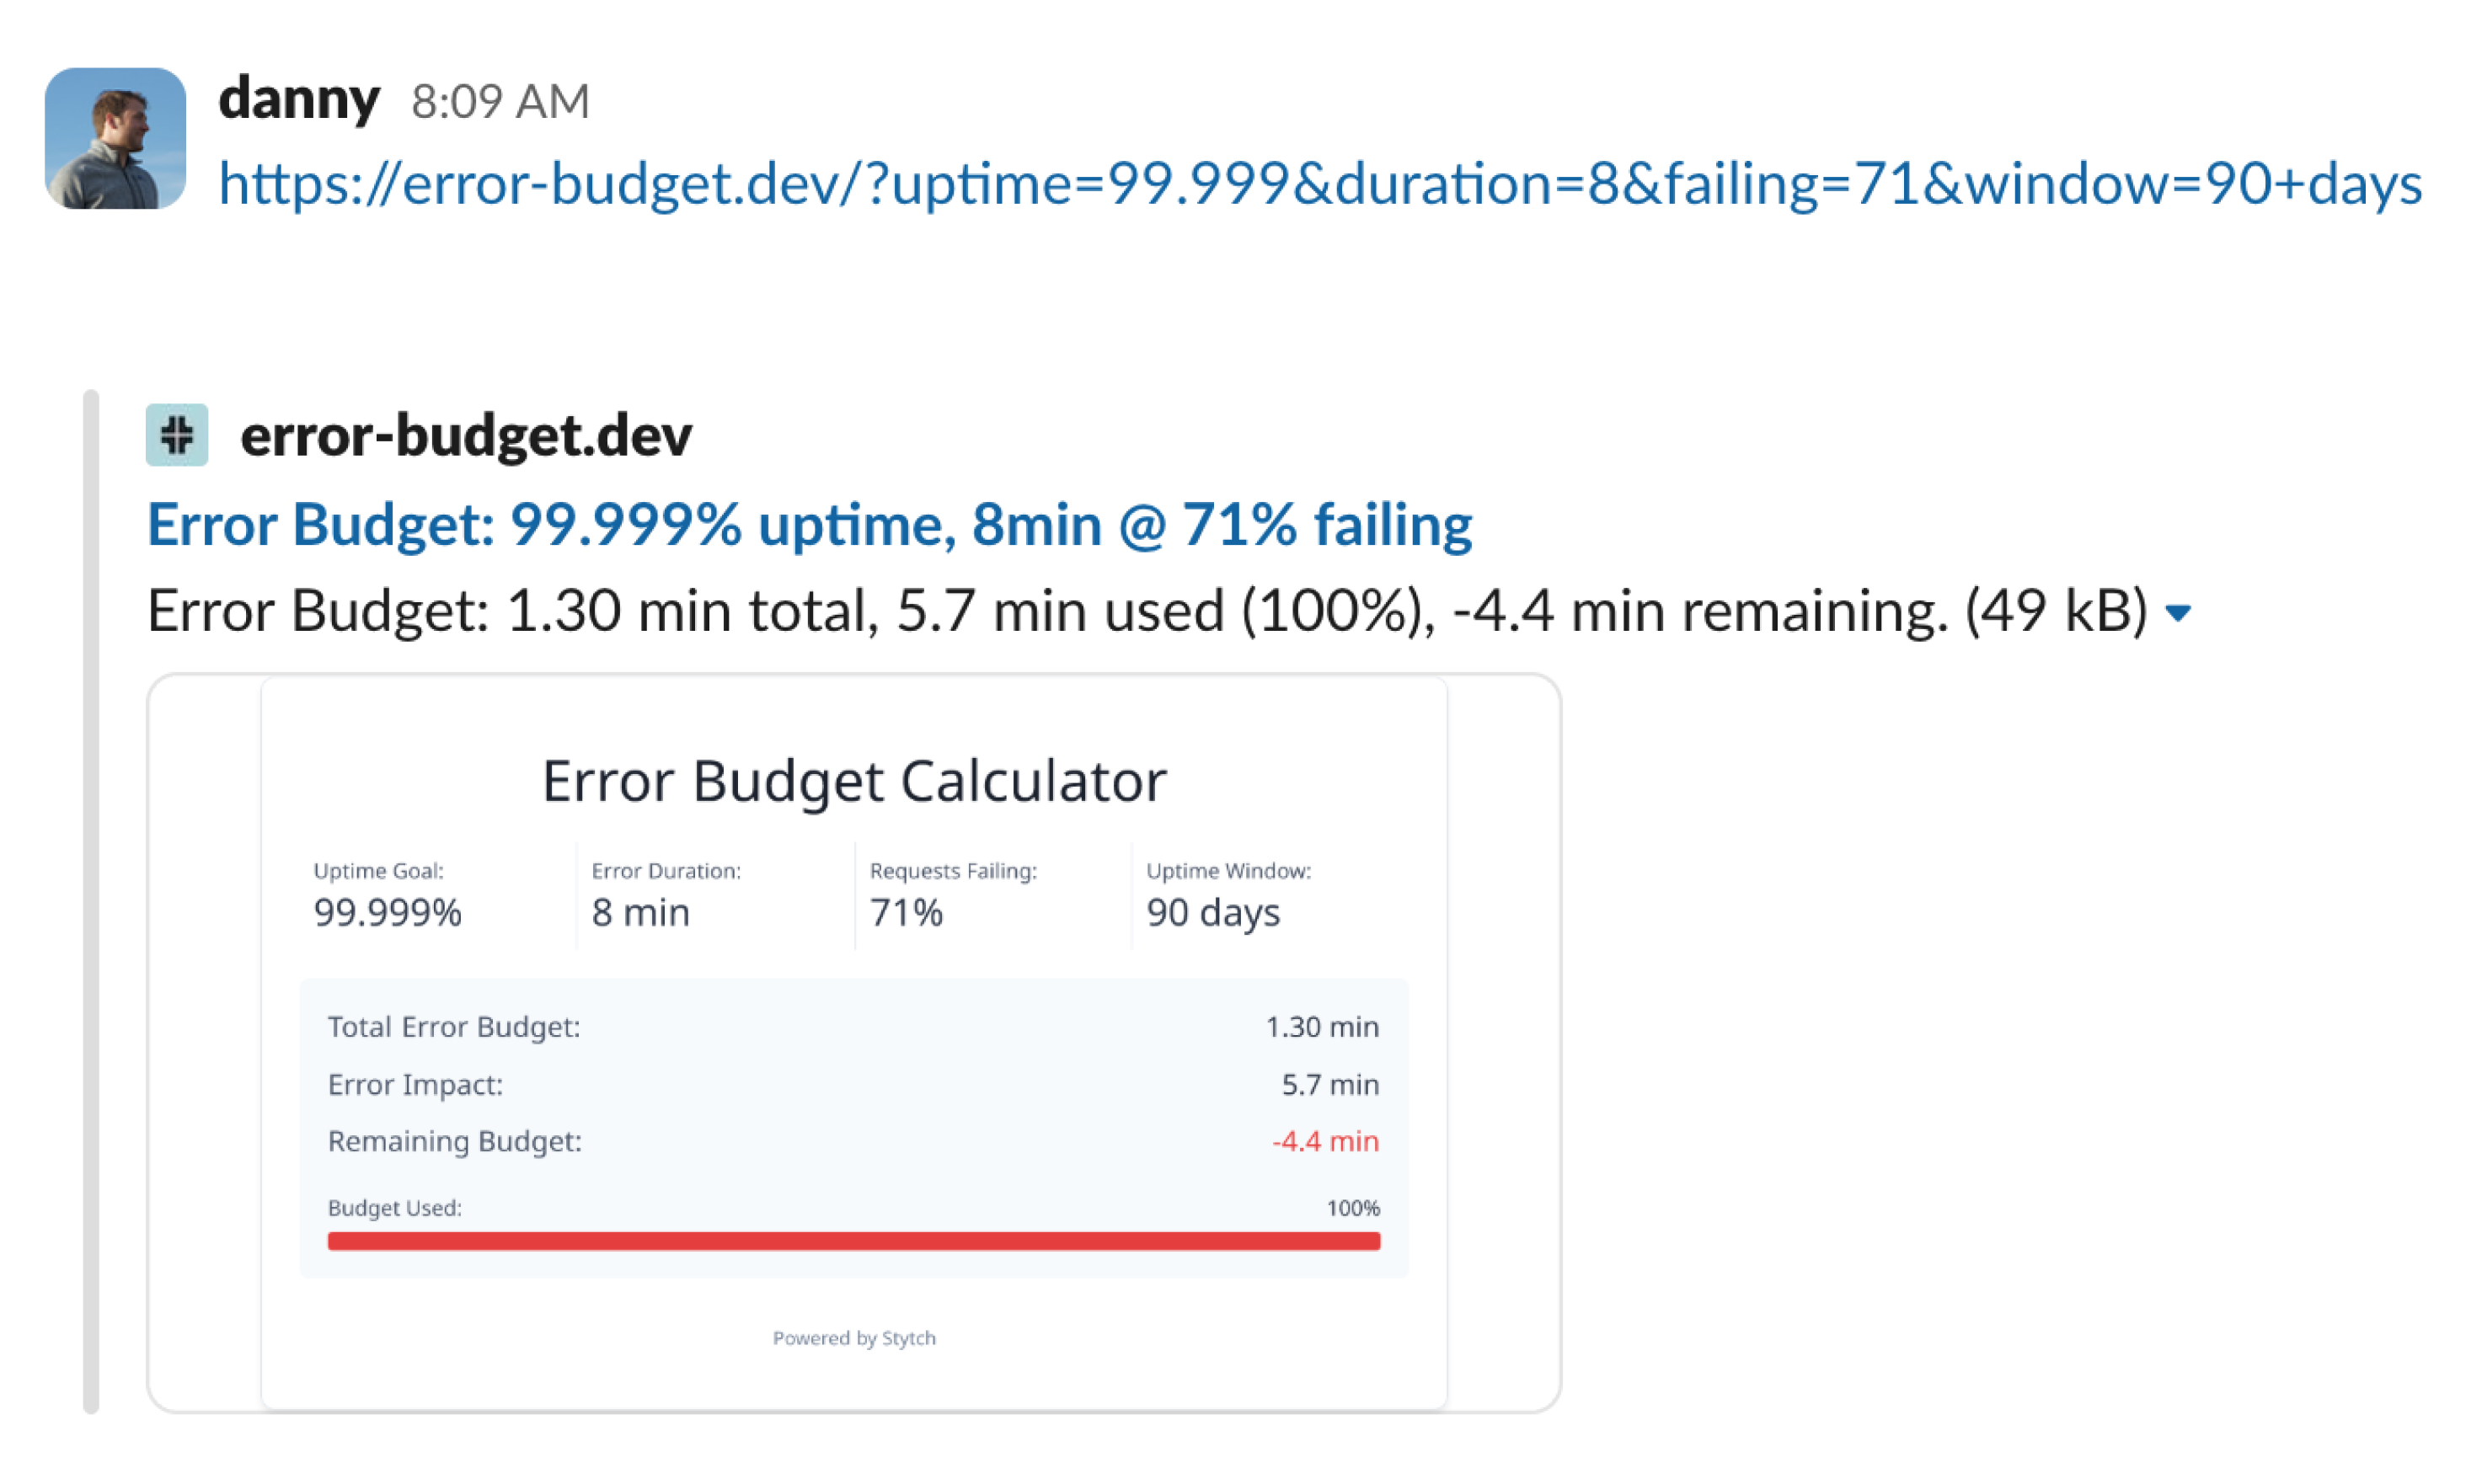
Dynamic Slack previews inspired by Honeycomb, where whenever a URL is posted, a Slack visual displaying the percentage of the error budget being consumed shows up. Cursor taught us that these previews are powered by Facebook’s Open Graph Protocol and implement dynamically generating the Preview Image, speeding up the process:
Once done, the app was deployed to Vercel and voilà—https://error-budget.dev went live!
A large part of error-budget.dev’s value is in its simplicity: it translates abstract metrics into something concrete that anyone on our team (or our customers!) can understand. Try it out and let us know what you think!
What’s next?
Now that the instrumentation and tooling are in place, we’re continuing to:
- Tune our alert thresholds.
- Expand coverage and define more granular SLOs.
- Integrate our internal SLA tracking with public status page metrics.
- A quarterly reevaluation of our SLOs to see if can better tune them.
We believe that robust, accurate SLA and SLO tracking isn’t just about customer understanding commitments—it’s about building a culture of reliability and transparency across our engineering organization.
Figure out your proper SLA with error-budget.dev. We’re excited to keep refining our approach—and welcome any feedback!
Authentication & Authorization
Fraud & Risk Prevention
© 2020-2026 Stytch. All rights reserved.