Back to blog
Upleveling our SQL models to manage DBT query speeds
Engineering
Oct 20, 2023
Author: Stytch Team
At Stytch we help developers create secure, defensible user authentication. Developers call our API to authenticate their endusers and prevent fraud and abuse on their applications. We route API request activity into our Snowflake data warehouse to enable our team to track and monitor the growth of our product suite.
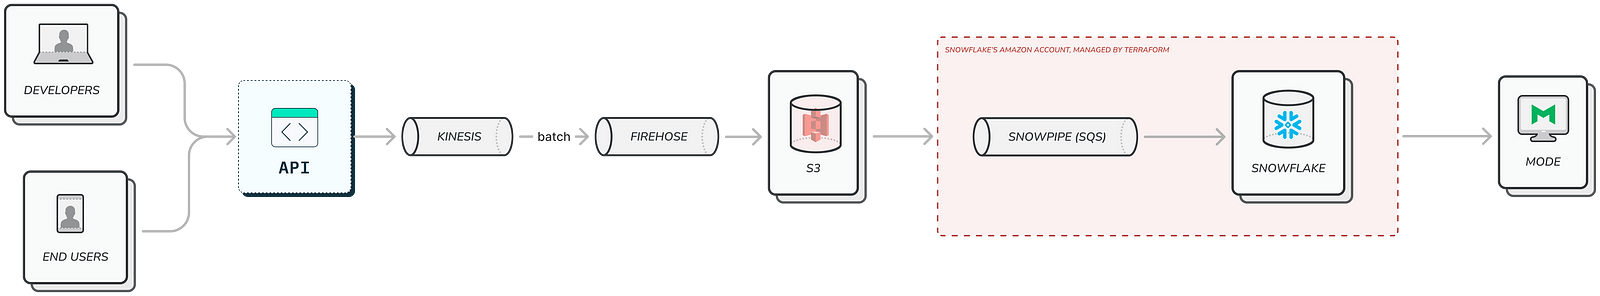
Data flows from our application into Snowflake for batch analytics.
Our goal is to ask a suite of analytics questions similar to APIs:
- How many customers and total endusers use each API endpoint?
- For each customer, how many of their users are authenticating with our different products like Email Magic Links, Passkeys, OAuth, Sessions, or Biometrics?
- How are these numbers growing day-over-day, and month-over-month?
Designing our first product analytics pipeline
When we built the first version of our SQL-based product analytics, we chose DBT as our transformation layer to take raw event data and clean, denormalize, and aggregate into the analytics layer stack. From the get-go, we were disciplined about separating the management of raw data from the visualization layer:
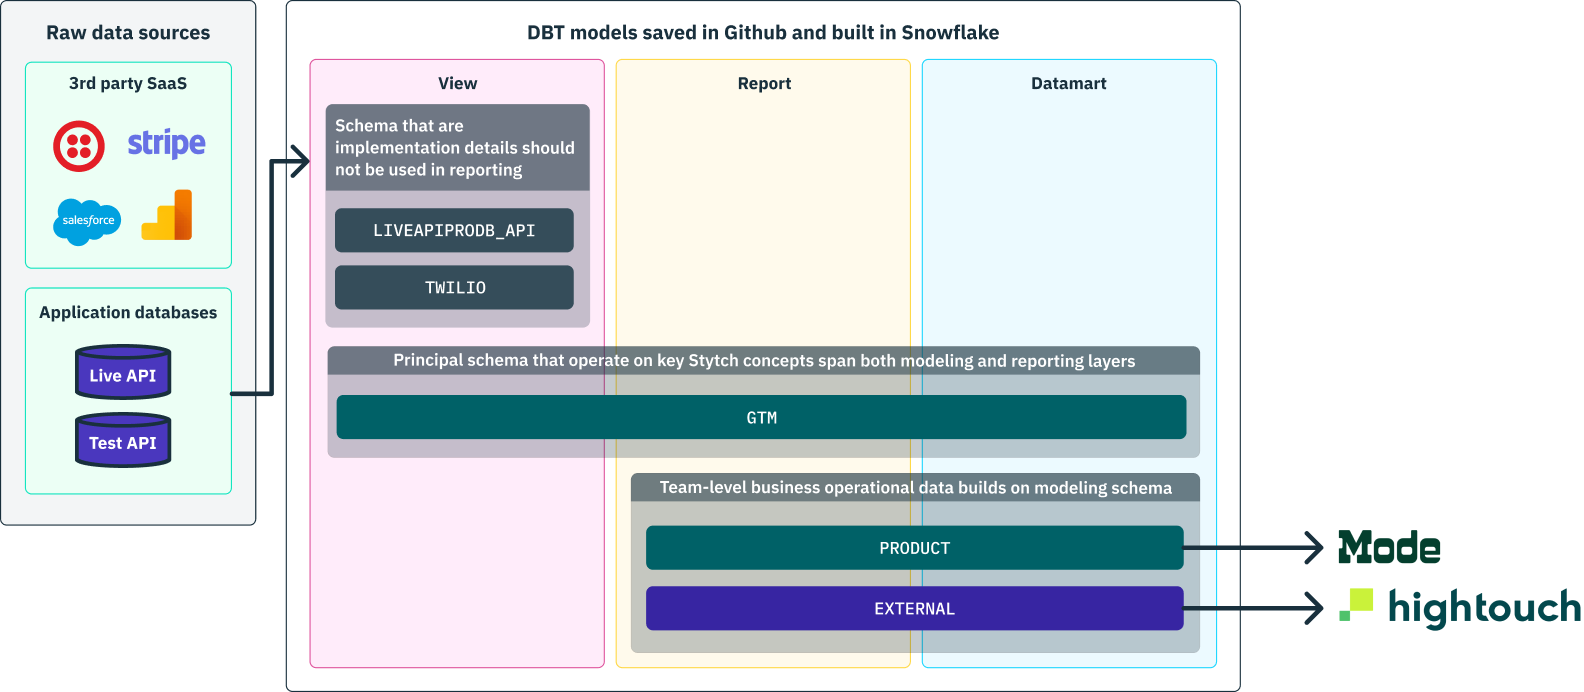
We organize SQL models into staging, reporting, and daramarts. This helps us control query performance, data access permissions, and stay organized.
We built the first version of our core product analytics in 2022. At that time, running the entire model pipeline end-to-end took about four minutes. Our SQL queries we’re simple, straight-forward implementations of what we wanted to query:
select
 customer_id
 , customer_name
 , product
 , date_trunc('month', event_created_at) as event_month_at
 , count(distinct end_user_id) as monthly_active_users_count
from
 authentication_events
group by
 1, 2, 3, 4
For example, to get the distinct number of monthly users for each customer and product, we can run a straight-forward count(distinct) on the users. This worked well at first, but as the company and API usage grew, it was untenable to recompute the entire analysis every time.
Using incremental update strategies
We turn to the standard DBT solution to build incremental models, rather than run a full update every time.
{{config(
 materialized='incremental',
 incremental_strategy='delete+insert',
 unique_key=['customer_id', 'product', 'event_month_at'],
)}} select
 customer_id
 , customer_name
 , product
 , date_trunc('month', event_created_at) as event_month_at
 , count(distinct end_user_id) as monthly_active_users_count
from
 authentication_events
{% if is_incremental() %}
 where
   event_created_at >= (select max(event_month_at) as event_month_at from {{ this }})
{% endif %}
group by  1, 2, 3, 4
This bought us several months of lede time. Now, instead of scanning the entire authentication_events table on each update, we only look at the most recent month worth of data. Using this trick, we were able to manage the steady growth of our SQL pipelines even as we added more data, more SQL queries, and more users building DBT models.
However, we hit a stopping point in September ’23 where leveraging this trick alone was insufficient — some of our query models were taking a long to run even when building incrementally across time periods. We had been leveraging the (very helpful!) DBT model timing chart to optimize queries, but had hit the limit of understanding.
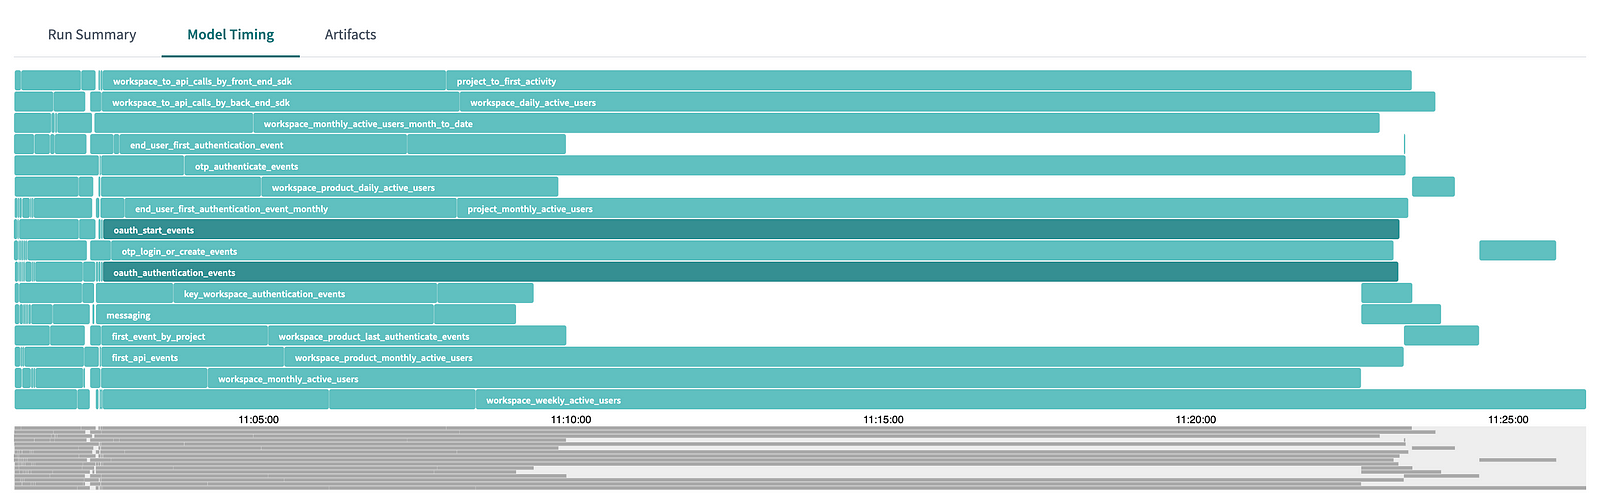
The total time to update our DBT pipeline was growing longer, and being dominated by the slowest queries.
Finding our count(distinct) problem
By 2023, our total pipeline had grown to include over 300 SQL models. We set more query threads in DBT than we have query slots in Snowflake, this helps us unsure that Snowflake is able to immediately start executing a query when a slot is available. Still, when we looked at the query queue pattern in Snowflake, we saw that queries were, in aggregate, spending more time in queue than executing — not a desirable pattern.
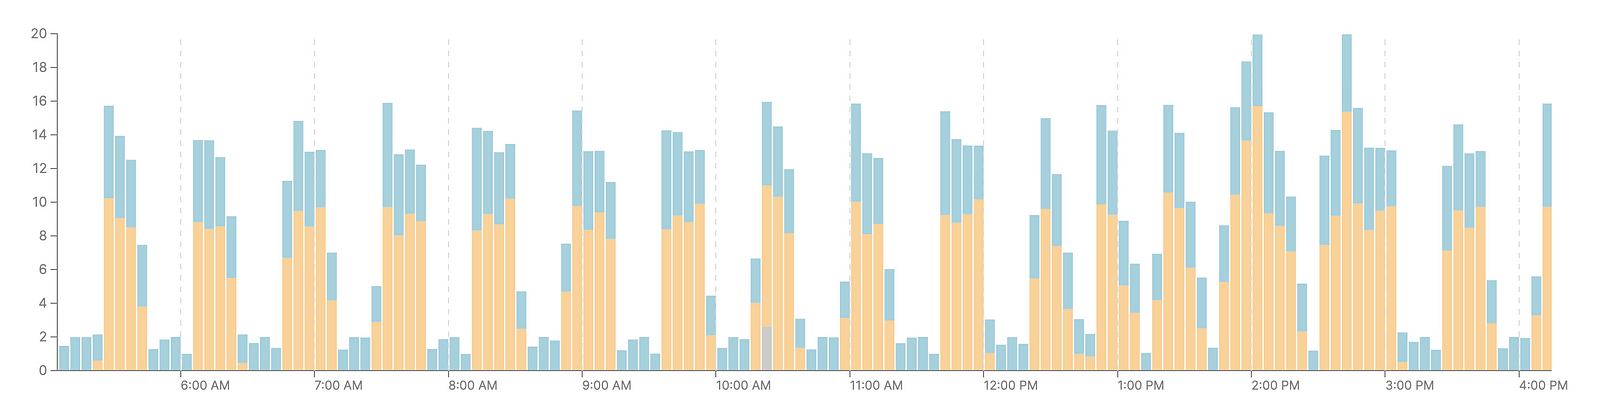
Our Snowflake Warehouse tasked with running our DBT pipeline would get flooded with queries. Long-running queries would block the queue, and our incremental updates were taking about 45 minutes to run.
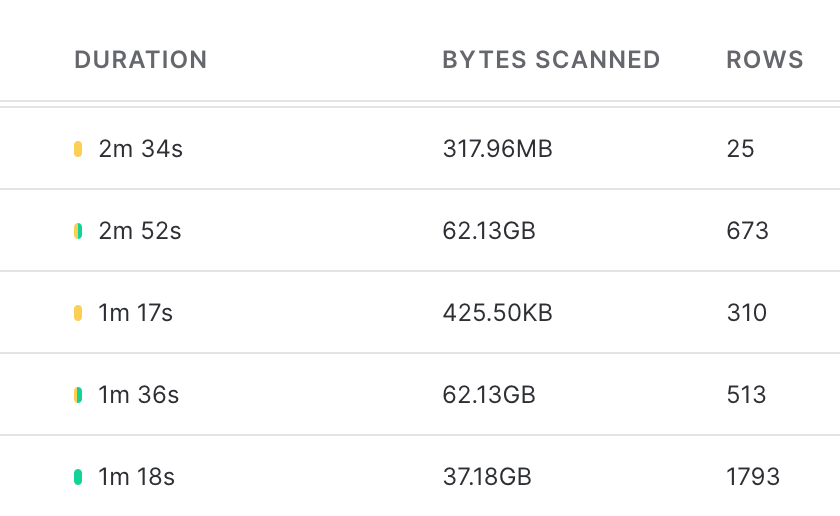
Diving into the Snowflake query dashboard, we saw a revealing trend: many of the queries that spent a long time executing were scanning a large amount of data, but then returning a small number of rows. These queries were the cause of our general slow-down, and generally these queries included a count(distinct) aggregation.
Green bars is time spent executing a query, yellow is time spent in queue.
The issue jumped out at us seeing numbers like 62.13GB of data being scanned for different queries. As our queries are fairly simple, our Snowflake performance is dictated by the time it takes for Snowflake to scan disk and load data.
Our first inquiry was to consider setting Snowflake cluster keys — maybe some of our incremental update strategies weren’t being recognized by Snowflake’s built-in data management systems, and we should provide clustering guidance in our DBT model configuration. However, we were a bit trepidatious to leverage this tool: once we start self administering the data layouts, we’re going to continually pay a human cost of thinking about table layouts when designing and iterating on models. We decided to first explore if there were logical design improvements that could be made to the models themselves.
Optimizing the whole pipeline
Our query pipeline had been built up with some organic growth. As the needs of the business grew and changed, we added more models and had different models querying the same raw staging datasets for similar, but slightly different, use-cases. Could we improve our design?
One type of analysis we conduct is to know what is the first time we encounter a new customer or end-user. For example, we keep track of the first time an enduser uses one of our products each month.
with first_event_ids_monthly as (
 select distinct first_value(event_id) over(
 partition by end_user_id, product, date_trunc('month', event_created_at)
 order by event_created_at
 ) as event_id
 from
 authentication_events
 )

select
 *
 , date_trunc('month', event_day_at) as event_month_at
from
 authentication_events
where
 event_id in (
 select
 event_id
 from
 first_event_ids_monthly
)
By using the first value Snowflake window function, we can keep track of the first time we see new combinations of a user and a product per month.
We can improve our original count(distinct) query performance by leveraging this dataset! Our original query can remove the need for a distinct count completely by taking the absolute count of rows in our user-centric table.
select
 workspace_id
 , workspace_name
 , product
 , date_trunc('month', event_created_at) as event_month_at
 , count(1) as monthly_active_users_count
from
 end_user_first_authentication_event_monthly
group by
 1, 2, 3, 4
By keeping incremental updates of the first time we see each of our users, and then computing the (non-distinct) count of rows across our user dataset, we’re able to optimize away the need for count(distinct) . On average, one user produces about 50 events per month, and we had reduced our query from looking at O(events) to O(users) data, a 98% reduction in data size. Snowflake was now once again able to run most of it’s queries out of the caching layer, removing the need for expensive disk scans.
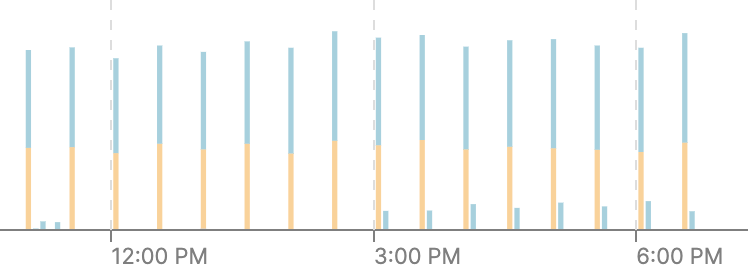
We are able to trigger all our DBT model pipeline and quickly churn through it.
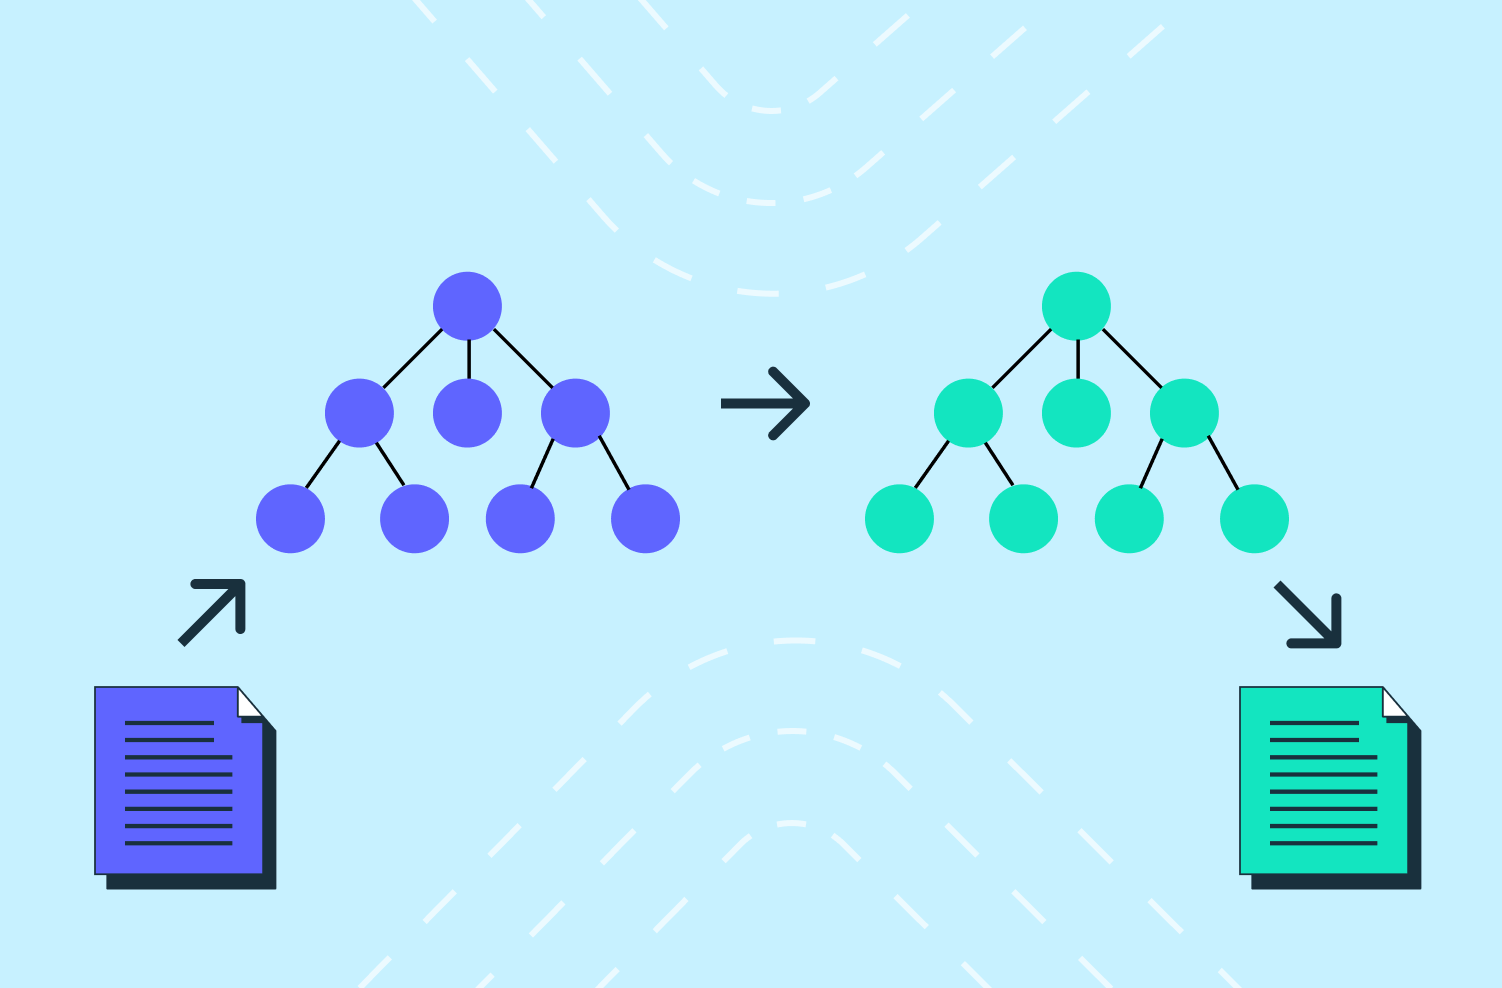
Applying model to our whole pipeline
We were able to apply this deduplication of effort strategy to our entire model hierarchy. The results were immediately apparent: our incremental update pipeline improved from running in 45 minutes to under four minutes by leveraging a logical refactoring of the data flow.

Authentication & Authorization
Fraud & Risk Prevention
Resources
Community
© 2020-2026 Stytch. All rights reserved.